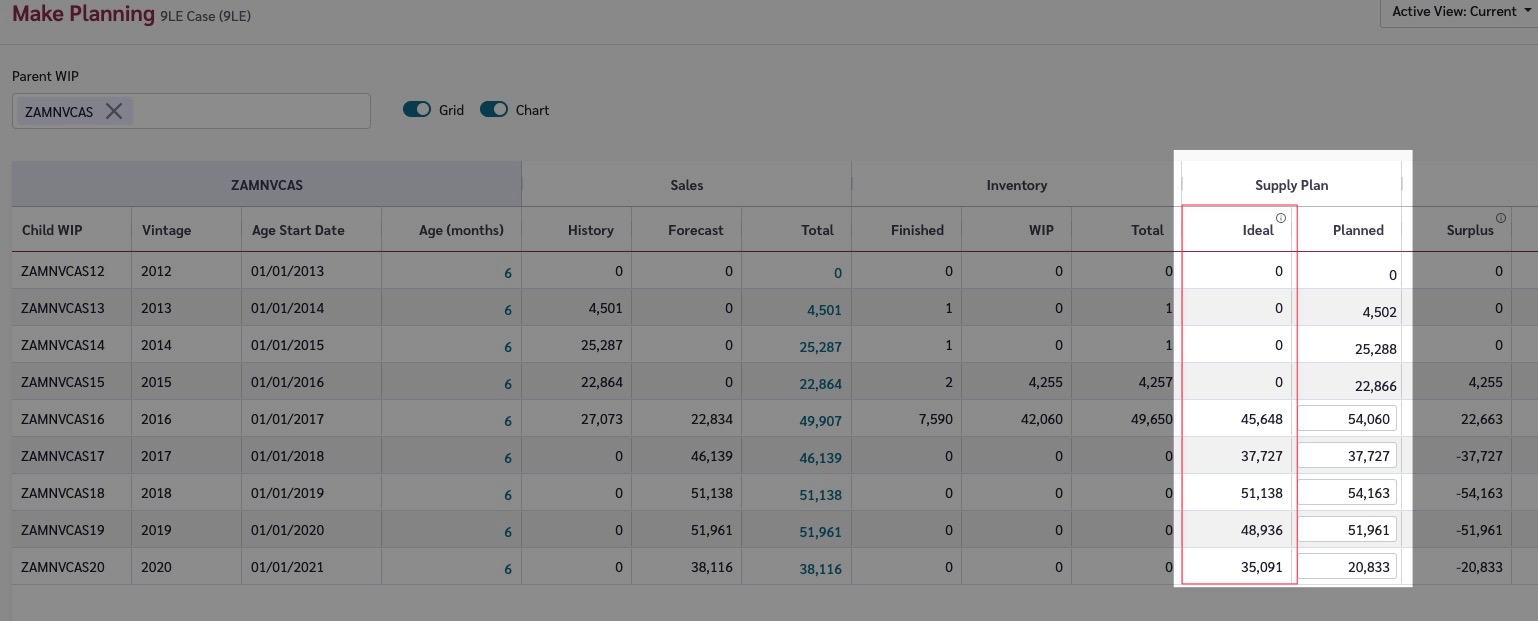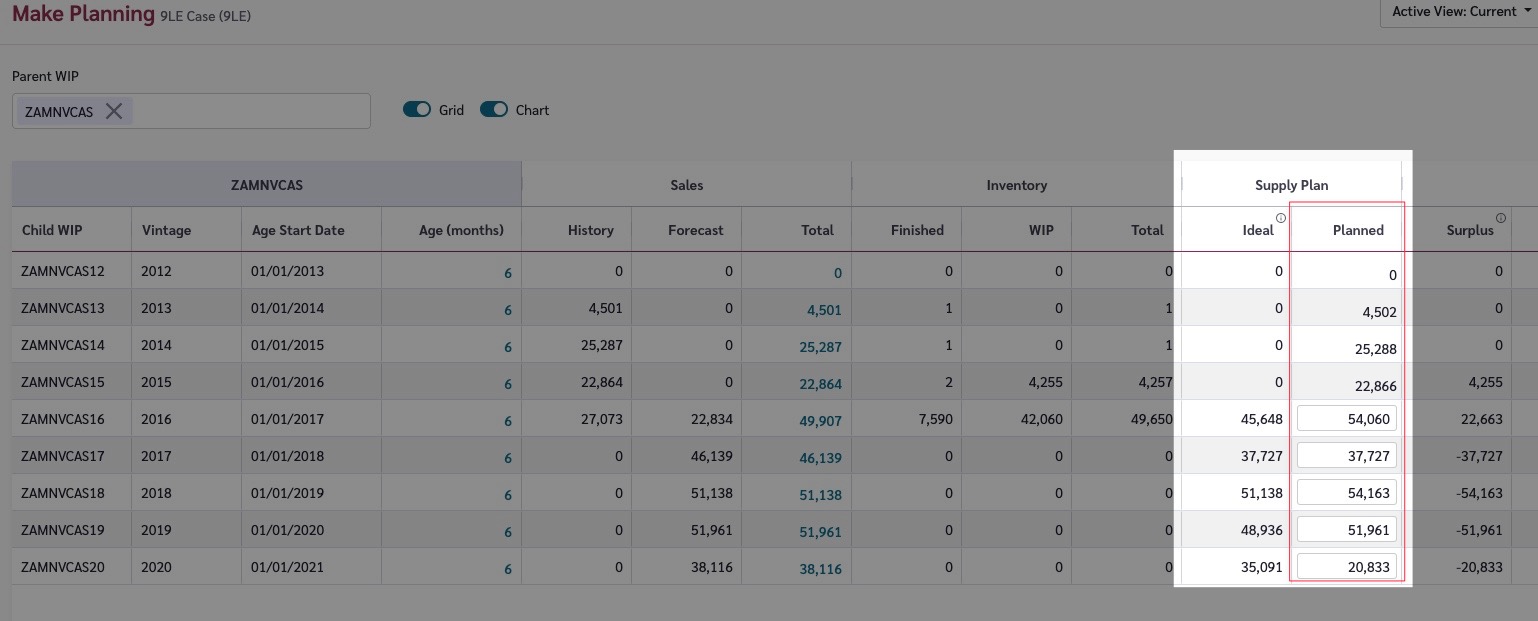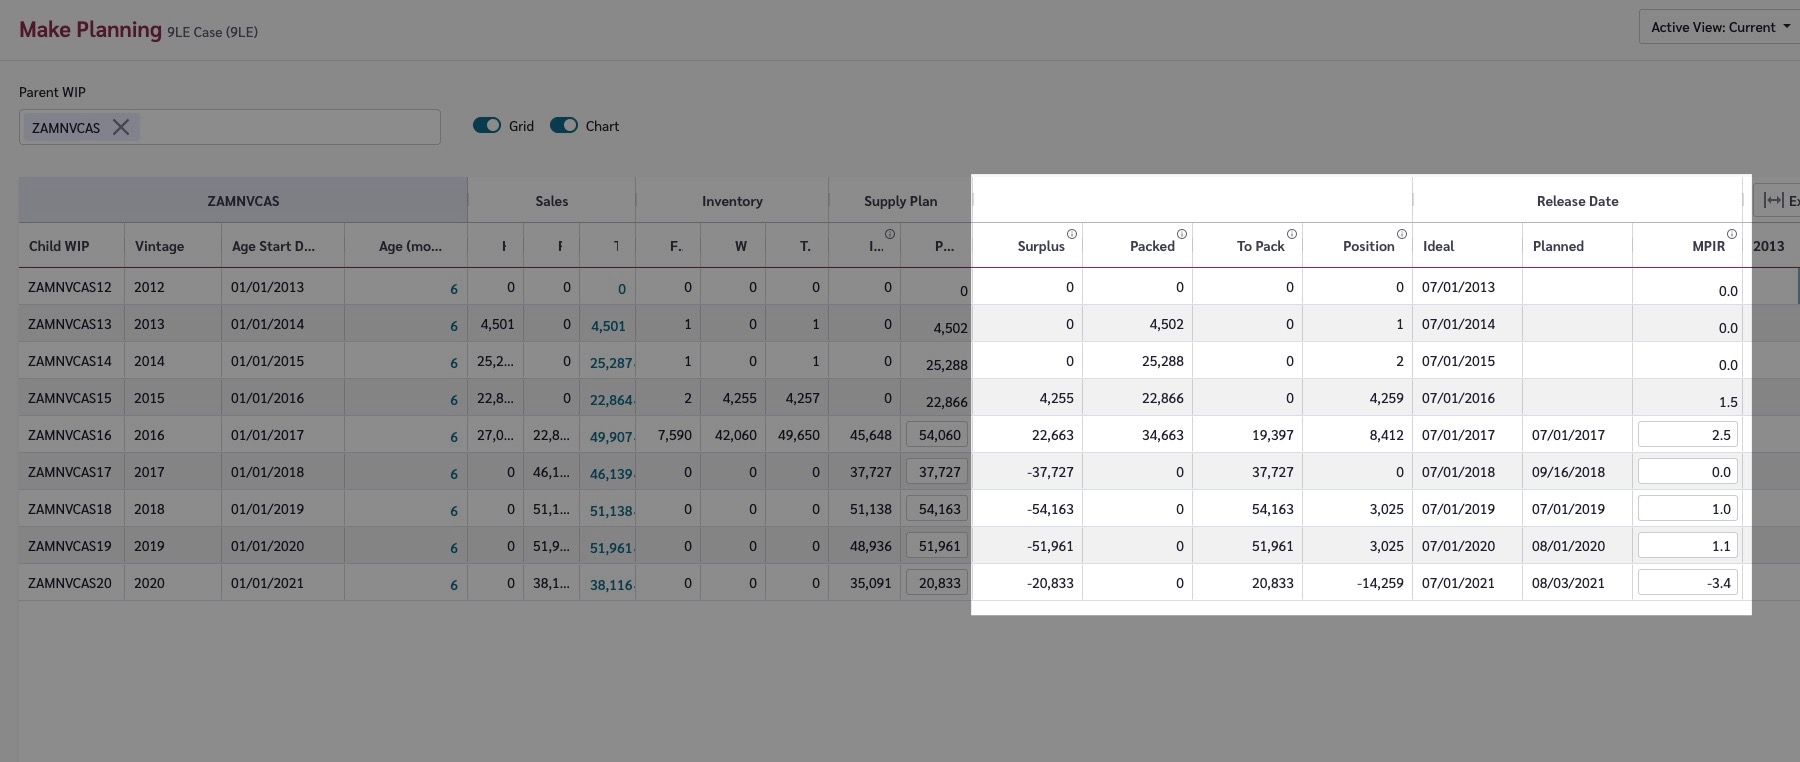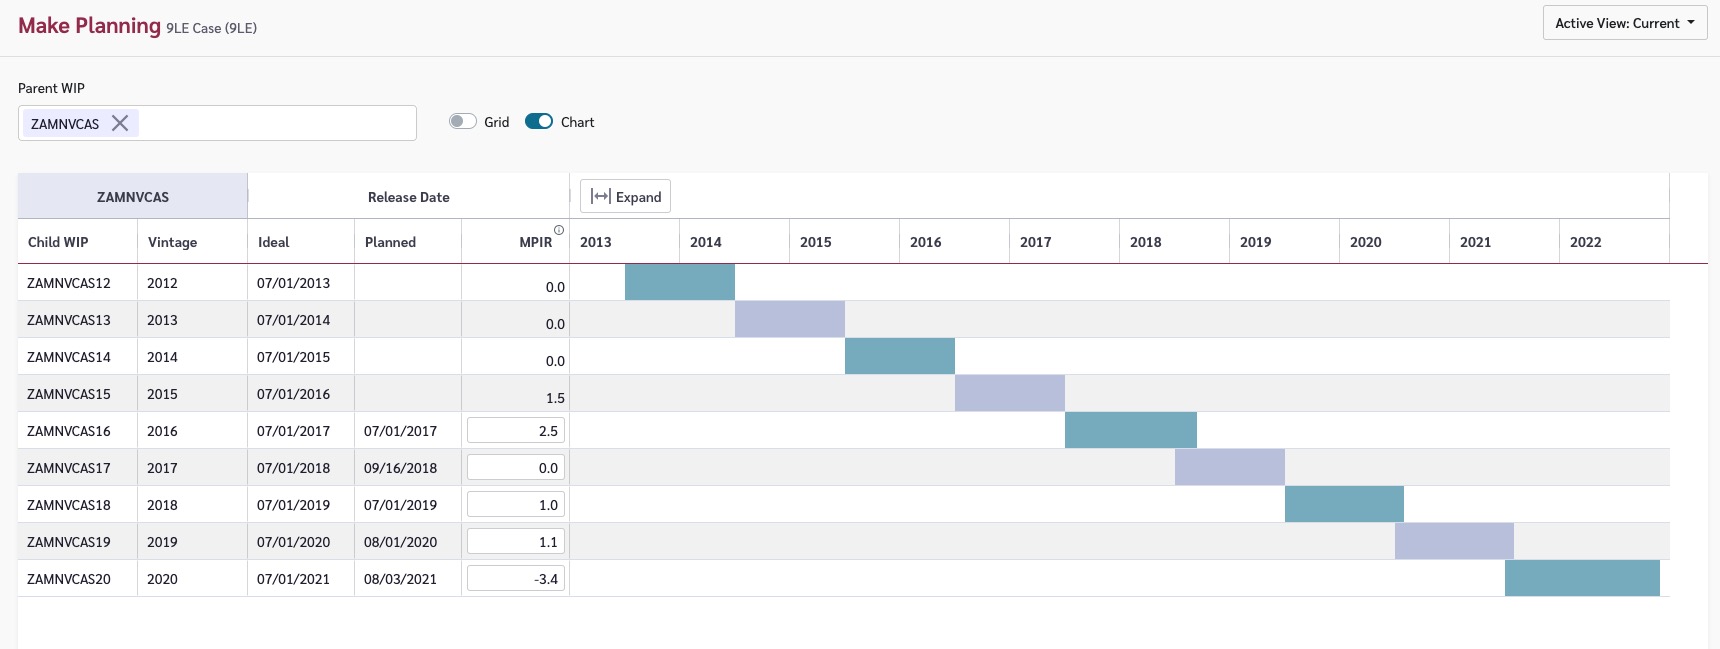

# Claret

Welcome to the Claret Documentation!

Claret is a powerful set of supply chain planning tools hand-crafted to help your company build operational and strategic plans that drive growth. From long term demand and supply plans to more operational monthly demand and supply plans, Claret allows you to focus on your business and not the tool.

![](/files/-MiXVPMMcQU9jdZl8sac)


# Navigating these Docs

How to use the Claret Documentation to ensure you get the best out of Claret and all it's features.


# Getting Started

Get started with Claret — setup guides for admin users configuring Claret modules and orientation guides for new users.

Welcome to Claret!

The Claret documentation is structured in the same way as the app itself. The menu on the left mirrors the menu within Claret so that you can easily find instructions and documentation for a section of the app as you use it.

## For Admin Users Setting Up Claret

If you're responsible for setting up Claret for your organization, we recommend stepping through the following:

1. [Navigating Claret](/using-claret/getting-started/navigating-claret) — understand the app layout and key concepts
2. [Global Settings](/using-claret/getting-started/global-settings) — review the calendars, hierarchies, and base data that have been set up for you
3. Set up your modules — step through the setup guide for each module you've purchased:

| Module                         | Setup Guide                                                                                                                           |
| ------------------------------ | ------------------------------------------------------------------------------------------------------------------------------------- |
| Sales Collaboration            | [Setting Up Sales Collaboration](/using-claret/getting-started/setting-up-modules/setting-up-sales-collaboration)                     |
| Long Term Planning             | [Setting Up Long Term Planning](/using-claret/getting-started/setting-up-modules/setting-up-long-term-planning)                       |
| Forecast Workbench             | [Setting Up Forecast Workbench](/using-claret/getting-started/setting-up-modules/setting-up-forecast-workbench)                       |
| Inventory Workbench - Partner  | [Setting Up Inventory Workbench - Partner](/using-claret/getting-started/setting-up-modules/setting-up-inventory-workbench-partner)   |
| Inventory Workbench - Internal | [Setting Up Inventory Workbench - Internal](/using-claret/getting-started/setting-up-modules/setting-up-inventory-workbench-internal) |
| Make Planning                  | [Setting Up Make Planning](/using-claret/getting-started/setting-up-modules/setting-up-make-planning)                                 |
| Crop Supply Planning           | [Setting Up Crop Supply Planning](/using-claret/getting-started/setting-up-modules/setting-up-crop-supply-planning)                   |

4. [Transactional Data](/using-claret/getting-started/transactional-data) — load your sales, inventory, and supply plan data

{% hint style="info" %}
Many modules share common data (Items, Customer Groups, Calendars). If you're setting up multiple modules, the setup guides will indicate what may already be done from previous module setups.
{% endhint %}

For a quick reference of all the master data required for each module, see [Setting up Modules](/using-claret/getting-started/setting-up-modules).

## For Users Getting Started with Claret

If your admin has already set up Claret and you're ready to start using it:

* [Your First Day in Claret](/using-claret/getting-started/your-first-day) — what to expect when you first log in, how to navigate, and your first tasks
* [Key Concepts](/using-claret/getting-started/key-concepts) — understand hierarchies, views, calendars, data flow, and other core ideas
* [Navigating Claret](/using-claret/getting-started/navigating-claret) — understand the app layout and navigation menu
* [Managing Views](/using-claret/getting-started/managing-views) — learn how to configure views to see the data you need

Each module also has a **Quick Start** guide for day-to-day users:

| Module                         | Quick Start                                                   |
| ------------------------------ | ------------------------------------------------------------- |
| Sales Collaboration            | [Quick Start](/sell/sales-collaboration/quick-start)          |
| Forecast Workbench             | [Quick Start](/sell/forecast-workbench/quick-start)           |
| Long Term Planning             | [Quick Start](/sell/long-term-planning/quick-start)           |
| Inventory Workbench - Partner  | [Quick Start](/sell/inventory-workbench-partner/quick-start)  |
| Inventory Workbench - Internal | [Quick Start](/pack/inventory-workbench-internal/quick-start) |
| Make Planning                  | [Quick Start](/make/make-planning/quick-start)                |
| Crop Supply Planning           | [Quick Start](/farm/crop-supply-planning/quick-start)         |


# Navigating Claret

Learn how to navigate Claret and understand key features

The Claret application is split into 3 key modules - Farm, Make and Sell. Within the app, there are some key concepts that it helps to know as you set up and use each module.

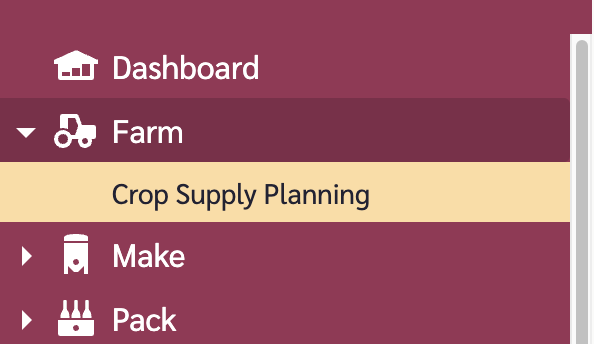
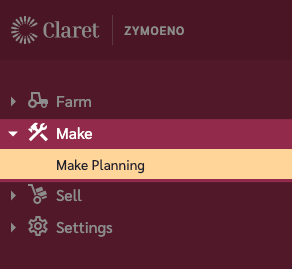
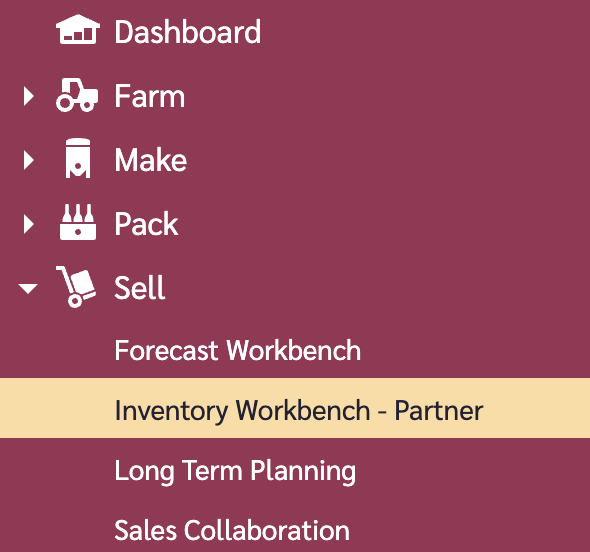
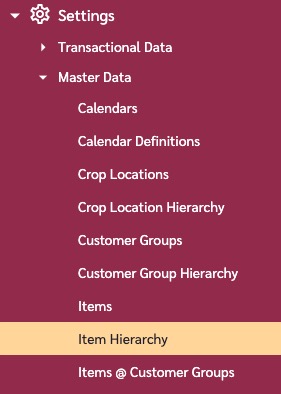
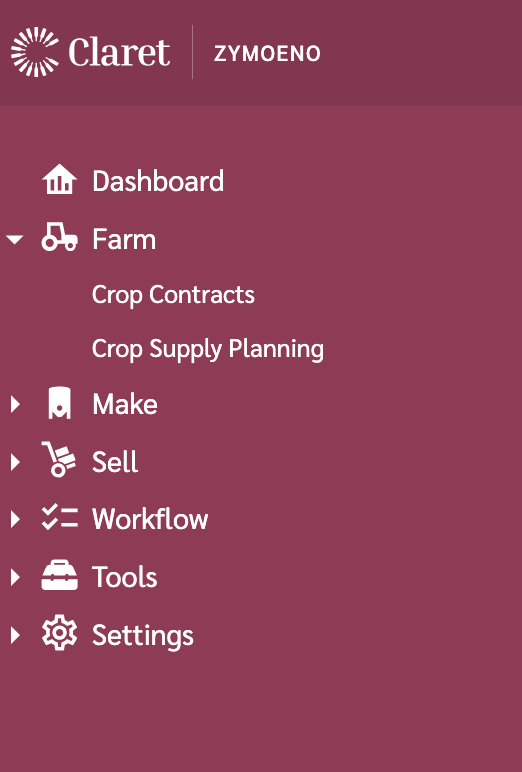
* **Navigation Menu** - the navigation menu on the left is how you navigate around Claret. You'll see multiple sections depending on the modules you have access to and whether or not you have permissions to manage Master Data. Use the arrows on the left of menu items to expand and see options beneath.

<figure><img src="/files/FsgejKsFECHV4o365kSw" alt="" width="261"><figcaption></figcaption></figure>

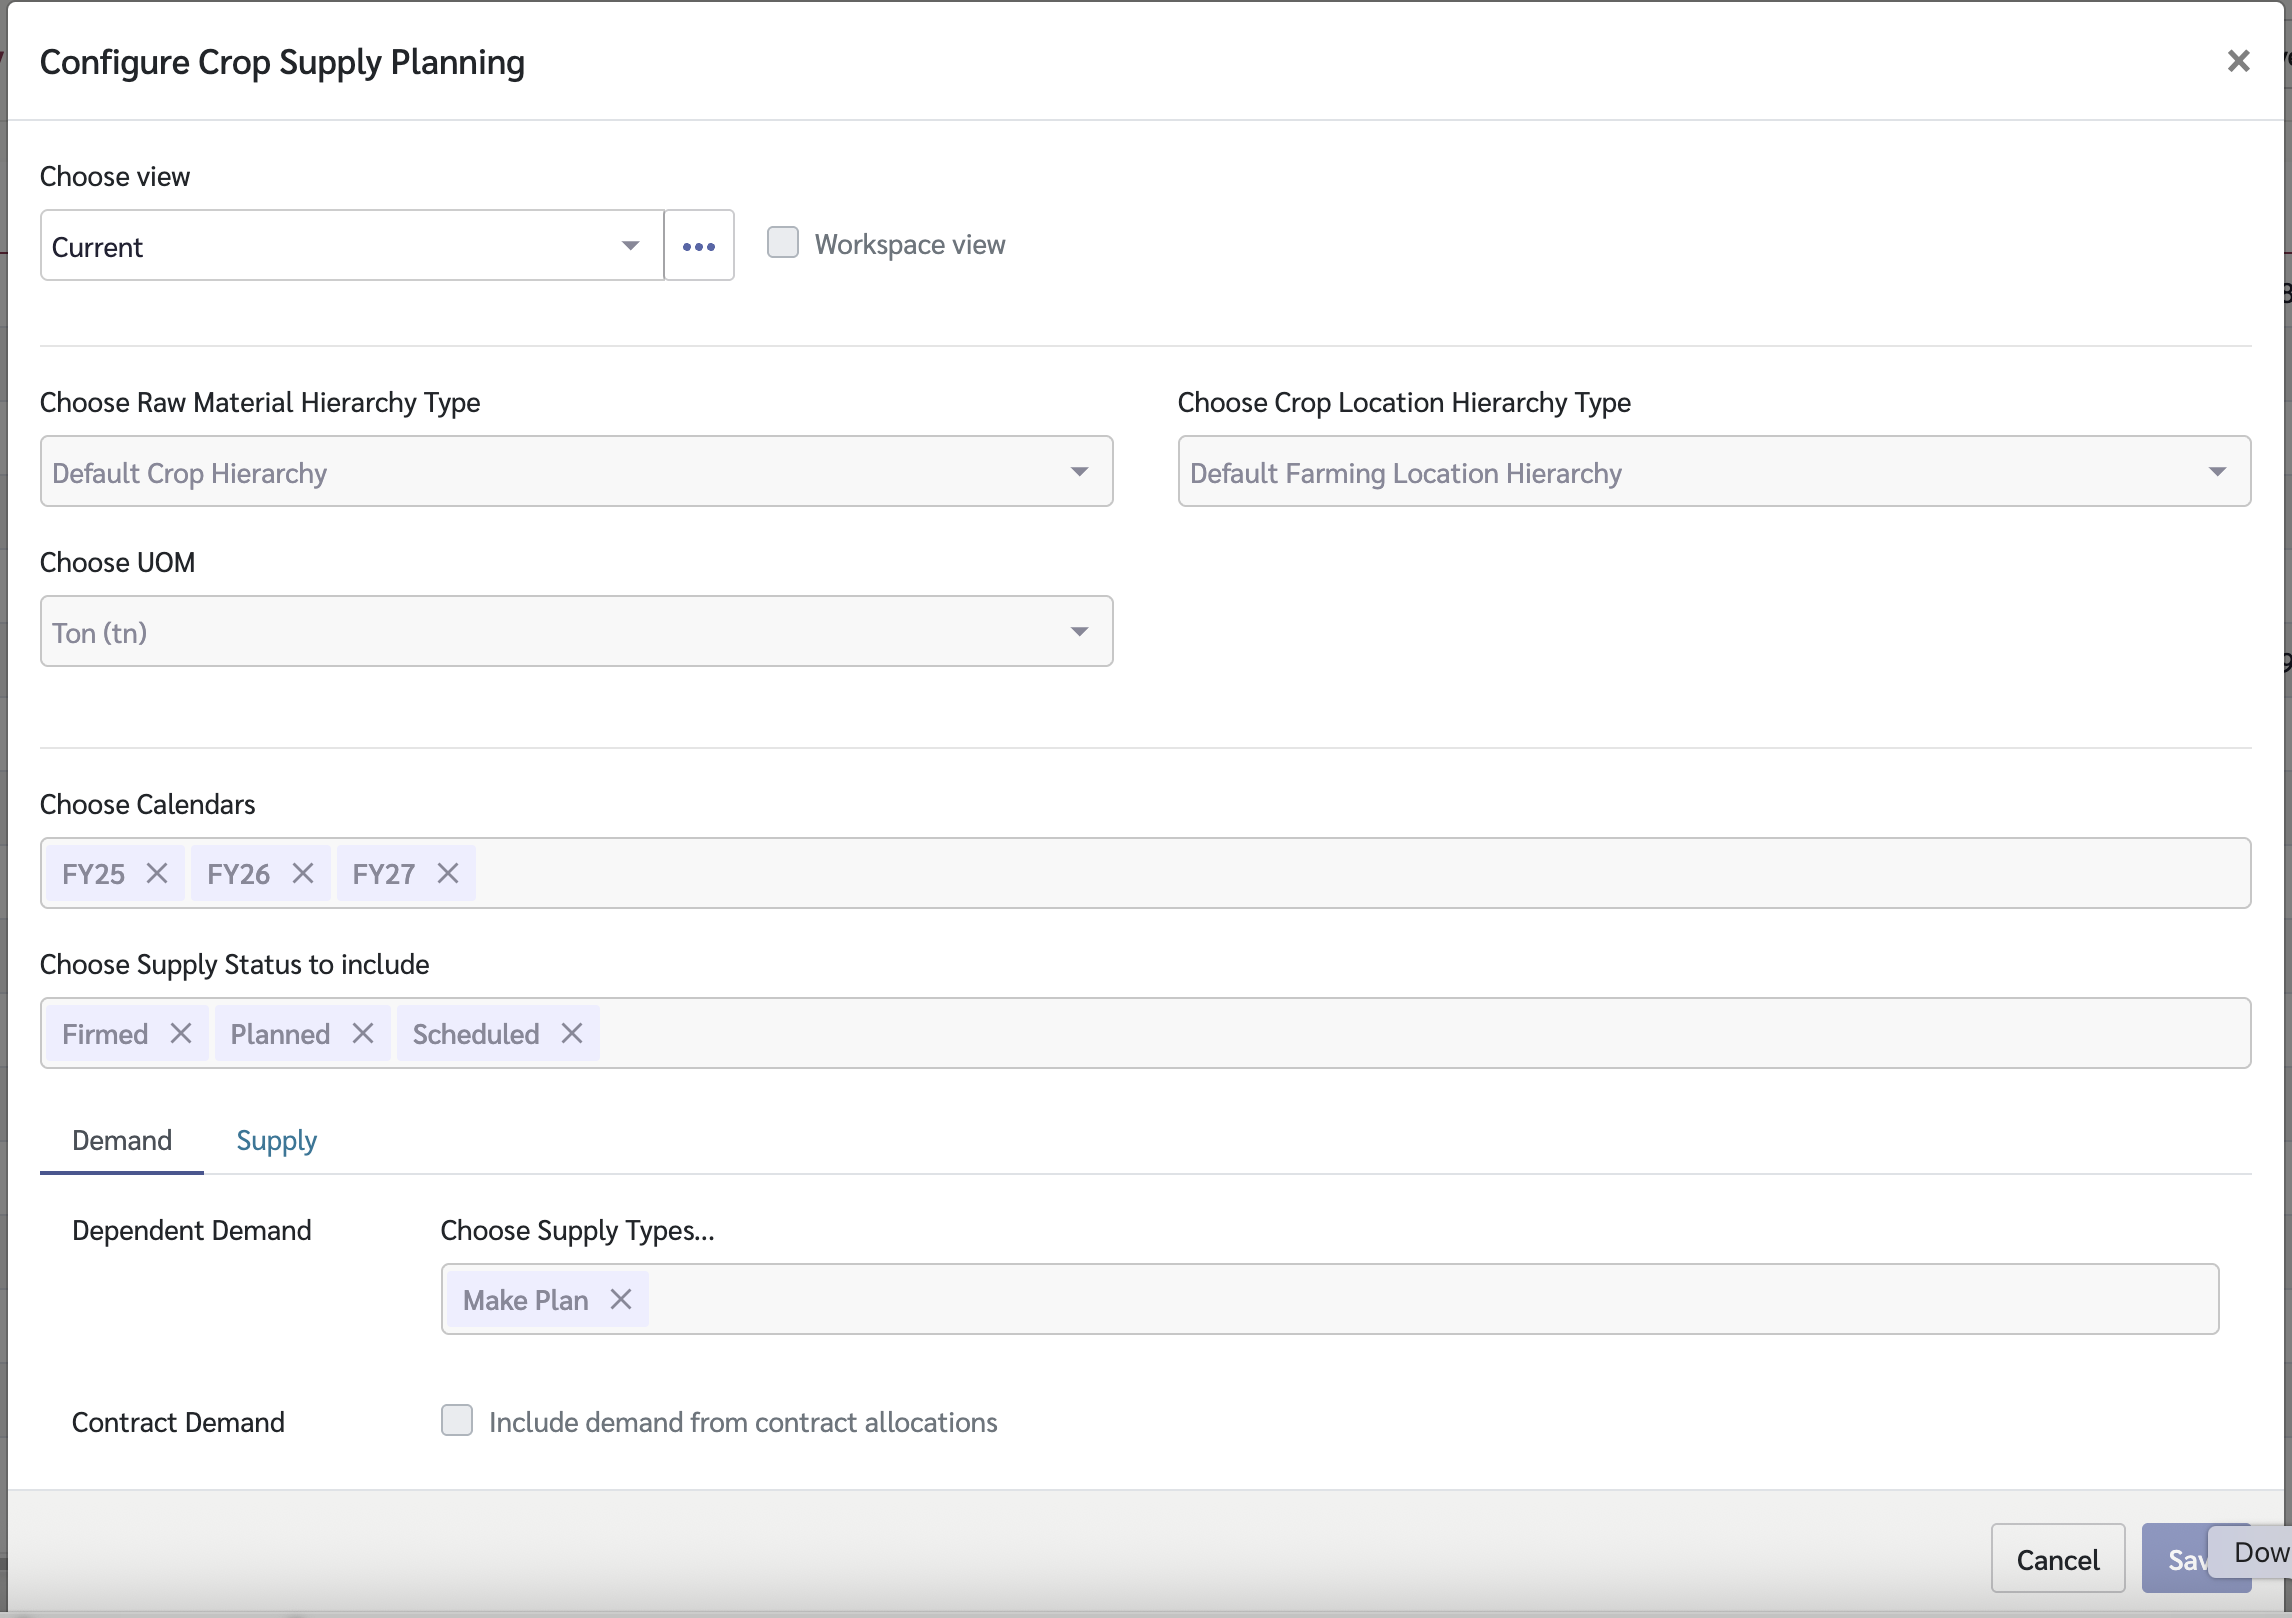
* **Views** - Module pages within Claret are driven by Views. Views are ways to present, analyse and manage your data. View configurations are always accessed on the top right hand area of a module. For more information on Views see [Managing Views](/using-claret/getting-started/managing-views).

<figure><img src="/files/4O1mBwMFkSANO4fdXFHR" alt=""><figcaption></figcaption></figure>

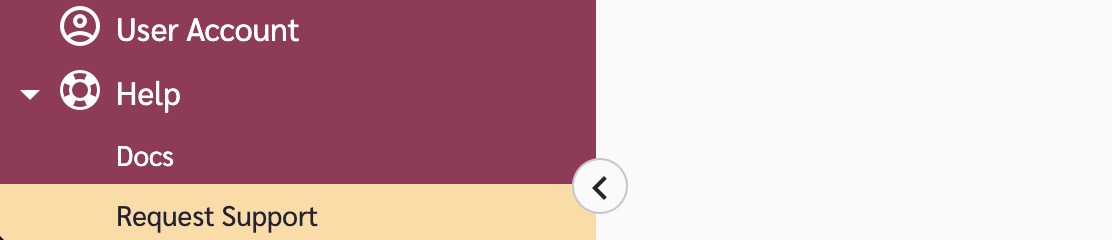
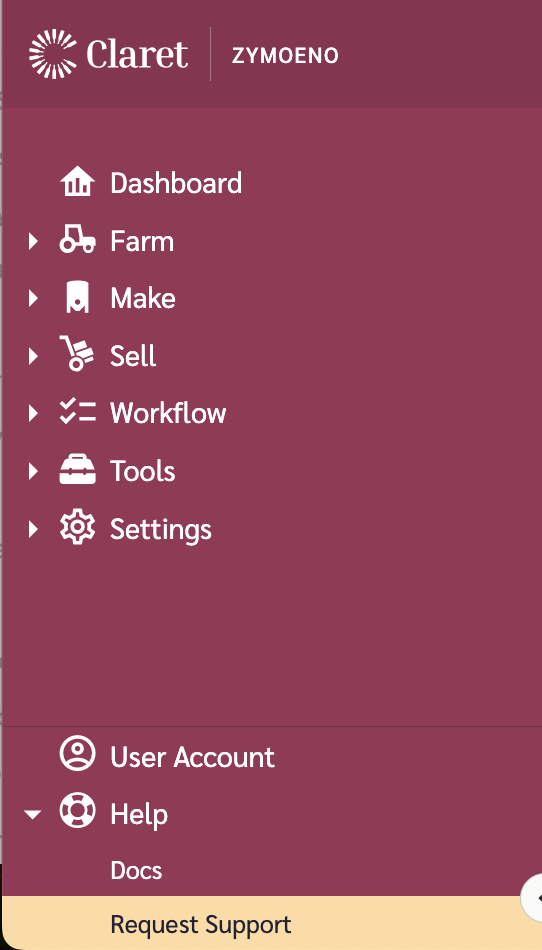
* **Help** - At any stage you can request support by expanding the 'Help' menu item and selecting 'Request Support'.

<figure><img src="/files/Z2e9GJWobox2mIyP6GDD" alt="" width="271"><figcaption></figcaption></figure>


# Your First Day in Claret

A guide for new Claret users — what to expect when you first log in, how to navigate the app, find your data, and get productive quickly.

Welcome to Claret! This page is designed for new users who have been given access to Claret by their organization's admin. Your admin has already set up the modules and data you'll be working with — this guide helps you find your way around and complete your first tasks.

## What to Expect When You Log In

When you first log in to Claret, you'll see:

* **The navigation menu** on the left — this is how you move between different parts of the app. The sections you see depend on which modules your organization uses and what permissions you have.
* **The main content area** — where you'll view and work with your data.
* **The header bar** — shows the current view name and provides access to configuration options.

<figure><img src="/files/FsgejKsFECHV4o365kSw" alt="" width="261"><figcaption><p>The Claret navigation menu on the left of the app</p></figcaption></figure>

{% hint style="info" %}
The navigation menu in Claret mirrors the structure of these docs. If you're looking at Sales Collaboration in the app, you'll find matching documentation under Sell > Sales Collaboration in the docs menu.
{% endhint %}

## Understanding the Navigation Menu

The navigation menu is organized by module area:

| Menu Section    | What It Contains                                                                           |
| --------------- | ------------------------------------------------------------------------------------------ |
| **Sell**        | Sales Collaboration, Forecast Workbench, Long Term Planning, Inventory Workbench - Partner |
| **Make**        | Make Planning                                                                              |
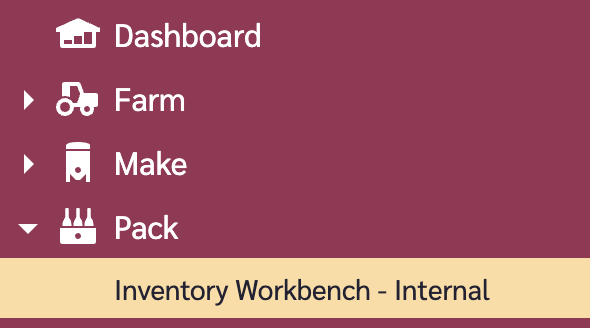
| **Pack**        | Inventory Workbench - Internal                                                             |
| **Farm**        | Crop Supply Planning                                                                       |
| **Master Data** | Reference data your admin manages (Items, Customers, Calendars, etc.)                      |
| **Settings**    | Transactional data imports, application settings, workspace settings                       |

Use the arrows next to menu items to expand and see sub-options. Not all sections may be visible to you — your admin controls which modules and permissions you have access to.

For more detail on the navigation layout, see [Navigating Claret](/using-claret/getting-started/navigating-claret).

## Finding and Switching Views

Most module pages in Claret are driven by **Views**. A view controls what data you see, how it's organized, and what time periods are displayed.

* The **current view name** is always shown in the top-right of the header bar.
* Click on the view name to see a list of available views and switch between them.
* **Workspace views** (marked with a "w") are shared views set up by your admin for everyone to use. These are a great starting point.
* **Personal views** are views you create for yourself. Only you can see these.

If you're new, start with a workspace view that your admin has set up. Once you're comfortable, you can create your own personal views to customize how you see data.

<figure><img src="/files/4O1mBwMFkSANO4fdXFHR" alt=""><figcaption><p>The view selector in the top-right of each module page</p></figcaption></figure>

For more on views, see [Managing Views](/using-claret/getting-started/managing-views).

## Understanding the Data You See

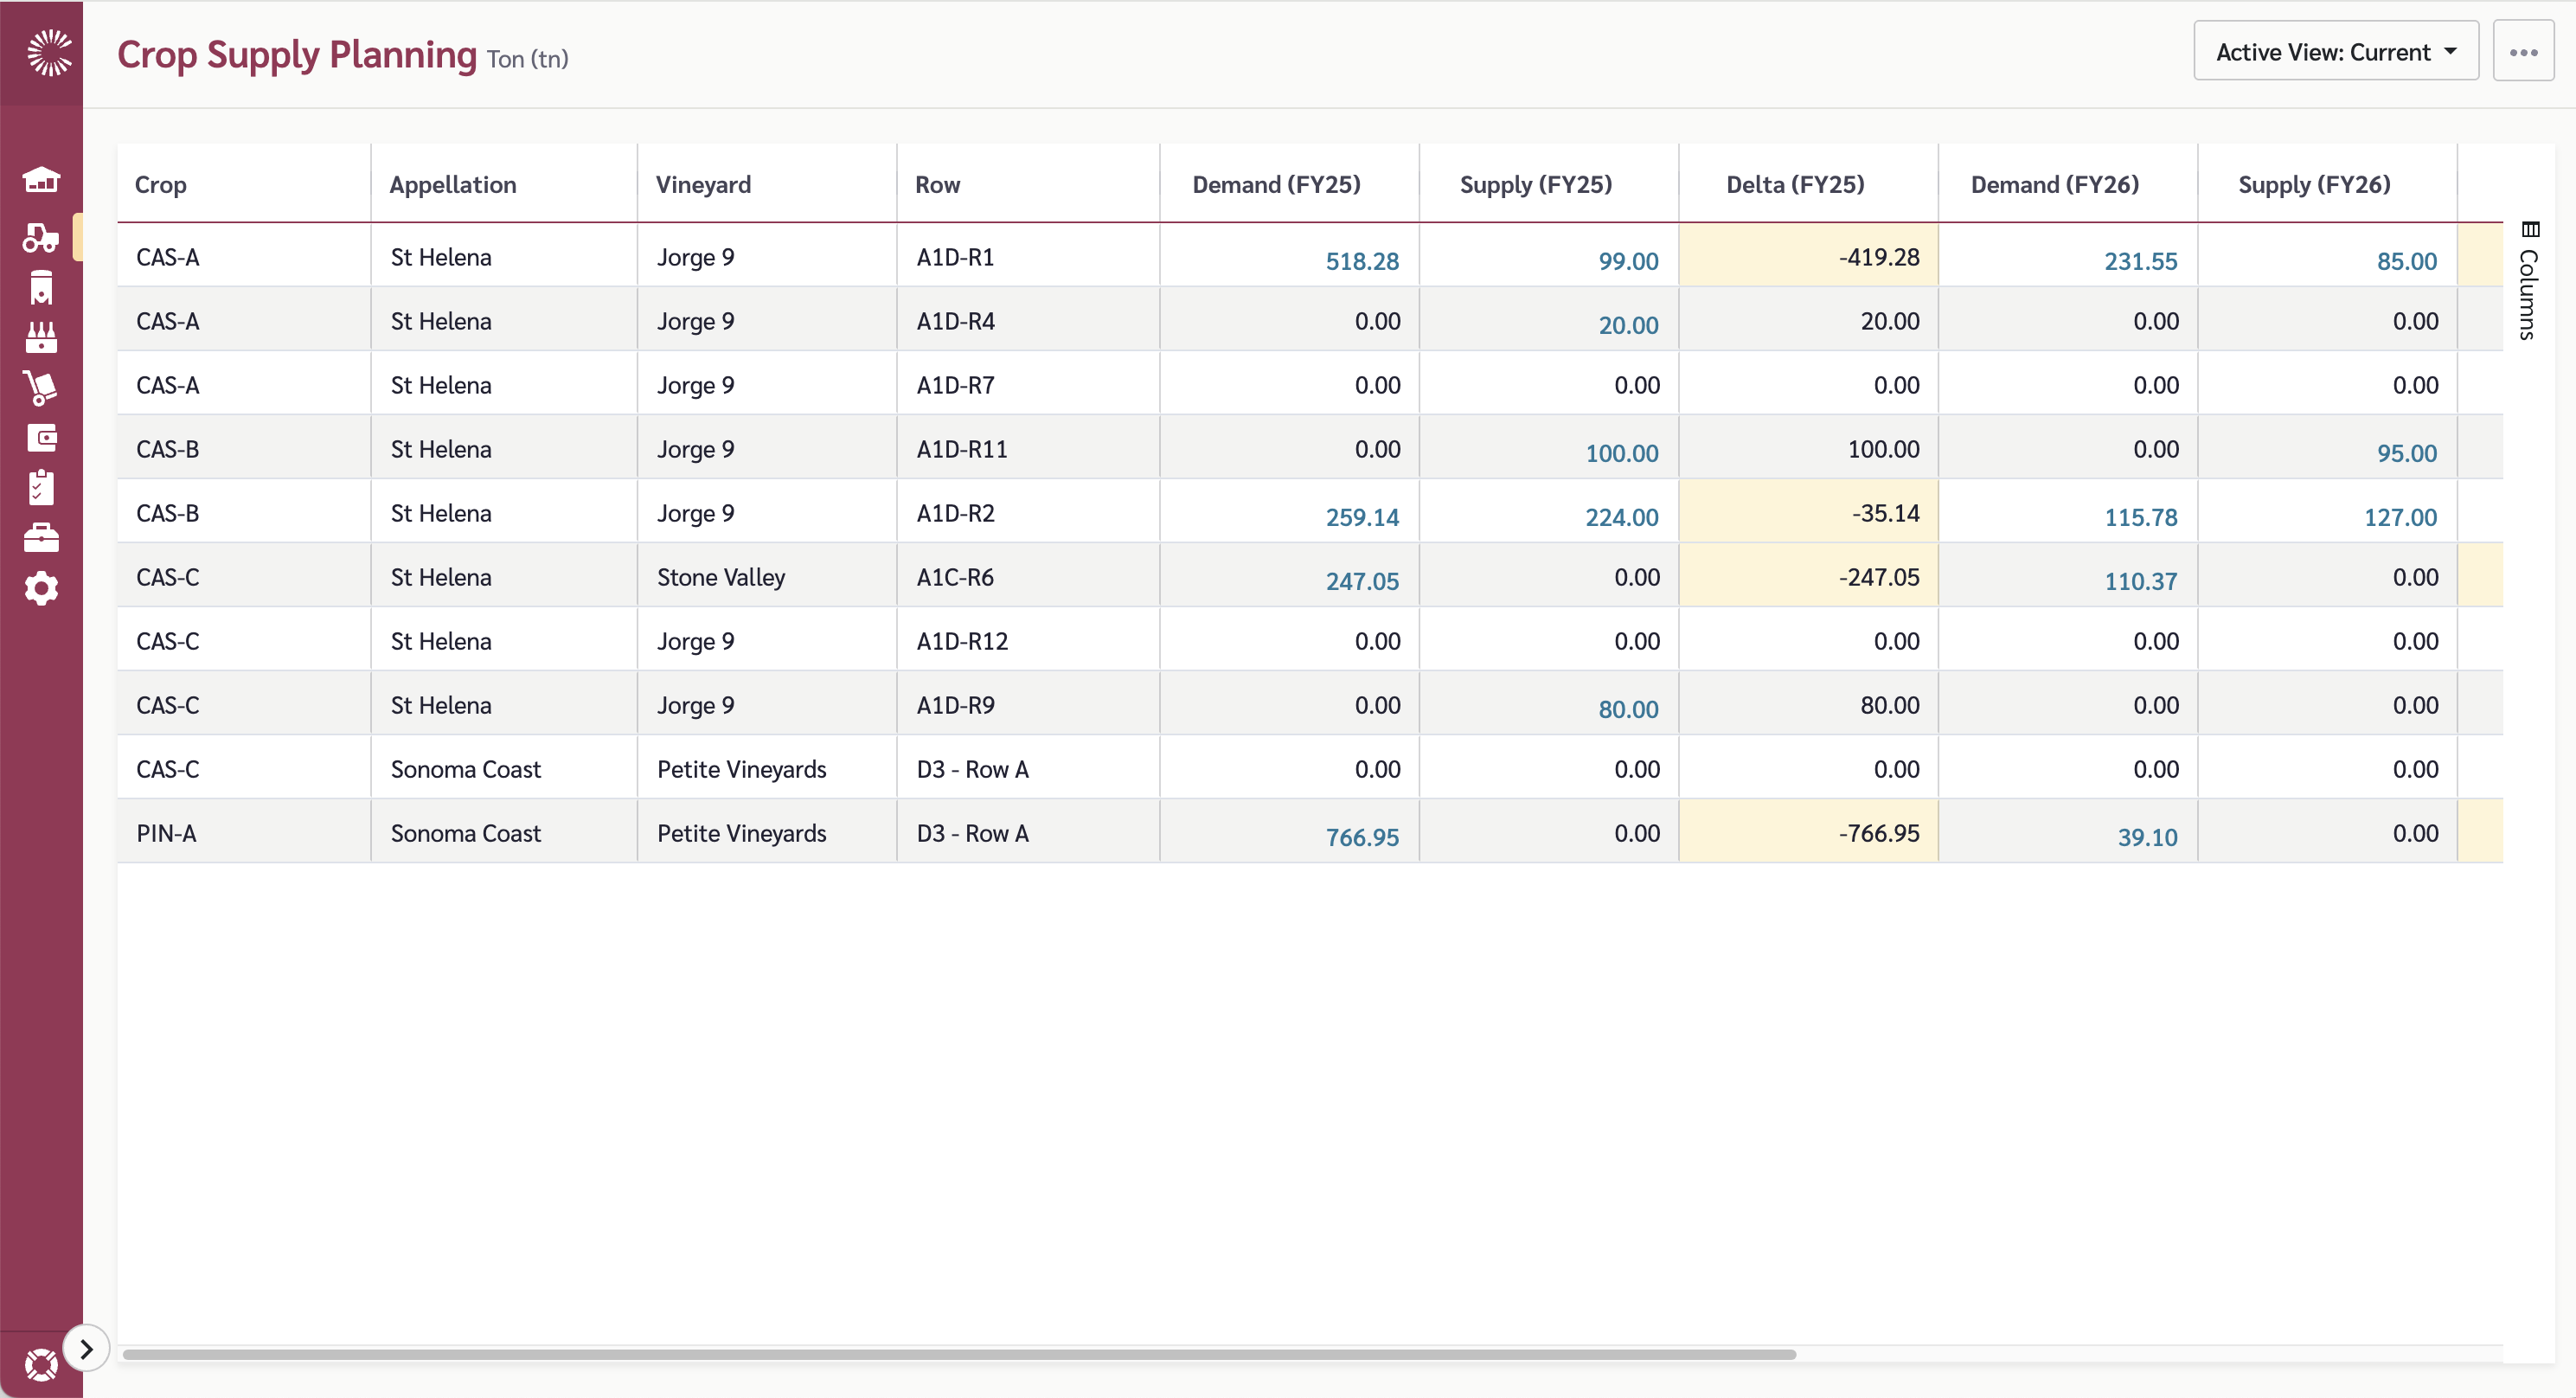
When you open a module page with an active view, you'll typically see a grid with:

* **Rows** representing items, customer groups, or other data categories
* **Columns** representing time periods (months, weeks, or fiscal years depending on the module)
* **Values** representing quantities — these could be sales figures, forecasts, inventory levels, or supply plans

The meaning of each column depends on the module and view configuration. Each module's documentation explains what the specific columns and values represent.

<figure><img src="/files/IZtku2IAszsKTQ21JT0q" alt=""><figcaption><p>Example of a module grid — rows on the left, time periods across the top</p></figcaption></figure>

{% hint style="info" %}
New to concepts like hierarchies, sale types, or reconciliation? See [Key Concepts](/using-claret/getting-started/key-concepts) for explanations of the terms and ideas you'll encounter across Claret.
{% endhint %}

## Your First Task: Explore a View and Apply a Filter

Try this to get comfortable with the interface:

1. **Navigate to a module** — click on a module in the left menu (e.g., Sell > Sales Collaboration)
2. **Select a view** — if a workspace view is available, select it from the view dropdown in the top-right
3. **Explore the grid** — scroll through the data to see what's there. Expand hierarchy rows by clicking the arrows on the left
4. **Apply a filter** — most grids support filtering. Look for filter options in column headers or the toolbar to narrow down to specific items or customers
5. **Try different hierarchy levels** — if the module has a hierarchy picker at the top, try selecting different levels to see data rolled up or broken down

## Where to Get Help

* **In-app support** — expand the Help section in the navigation menu and select "Request Support" to reach the Claret support team
* **AI Assistant** — if enabled for your workspace, the AI Assistant can answer questions about how Claret works and guide you through tasks
* **These docs** — use the search function or browse by module to find detailed instructions

<figure><img src="/files/Z2e9GJWobox2mIyP6GDD" alt="" width="271"><figcaption><p>Expand the Help section in the navigation menu to request support</p></figcaption></figure>

## Module Quick-Start Guides

Ready to dive into a specific module? These quick-start guides walk you through the essentials for each module as a regular user:

| Module                         | Quick Start                                                                                   |
| ------------------------------ | --------------------------------------------------------------------------------------------- |
| Sales Collaboration            | [Quick Start: Sales Collaboration](/sell/sales-collaboration/quick-start)                     |
| Forecast Workbench             | [Quick Start: Forecast Workbench](/sell/forecast-workbench/quick-start)                       |
| Long Term Planning             | [Quick Start: Long Term Planning](/sell/long-term-planning/quick-start)                       |
| Inventory Workbench - Partner  | [Quick Start: Inventory Workbench - Partner](/sell/inventory-workbench-partner/quick-start)   |
| Inventory Workbench - Internal | [Quick Start: Inventory Workbench - Internal](/pack/inventory-workbench-internal/quick-start) |
| Make Planning                  | [Quick Start: Make Planning](/make/make-planning/quick-start)                                 |
| Crop Supply Planning           | [Quick Start: Crop Supply Planning](/farm/crop-supply-planning/quick-start)                   |

## Common Questions

### I can't see any modules in the navigation menu

Your admin controls which modules you have access to. Contact your admin or workspace owner to check your permissions. See [Team Member Privileges](/workspace-settings/team/team-member-privileges) for how permissions work.

### The page is empty when I open a module

Most modules require an active view before they display data. Check the view dropdown in the top-right — you may need to select a workspace view or create a personal view.

### I see data but don't understand what the columns mean

Each module has its own documentation explaining the grid layout and columns. Navigate to the relevant module section in these docs, or check the module-specific quick-start guides linked above.


# Key Concepts

Core concepts in Claret explained — modules, hierarchies, views, calendars, history vs forecast data, reconciliation, data flow between modules, and deltas and variance.

This page explains the core ideas and terminology you'll encounter across Claret. Each section is self-contained — you can read them in any order or jump to the one that's relevant to you.

## Modules

Claret is organized into four main areas that reflect the flow of a supply chain:

* **Sell** — modules focused on demand planning and sales forecasting. Includes Sales Collaboration, Forecast Workbench, Long Term Planning, and Inventory Workbench - Partner.
* **Make** — modules focused on production planning. Includes Make Planning.
* **Pack** — modules focused on internal inventory balancing. Includes Inventory Workbench - Internal.
* **Farm** — modules focused on raw material and crop supply planning. Includes Crop Supply Planning.

Data flows from Sell (demand) through Make (production) and Pack (inventory) to Farm (raw materials). For example, a sales forecast entered in Sales Collaboration feeds into Make Planning as demand, and Make Planning's production requirements feed into Crop Supply Planning as crop demand.

Not every organization uses all modules. Your admin configures which modules are active for your workspace based on what your organization has purchased.

## Hierarchies

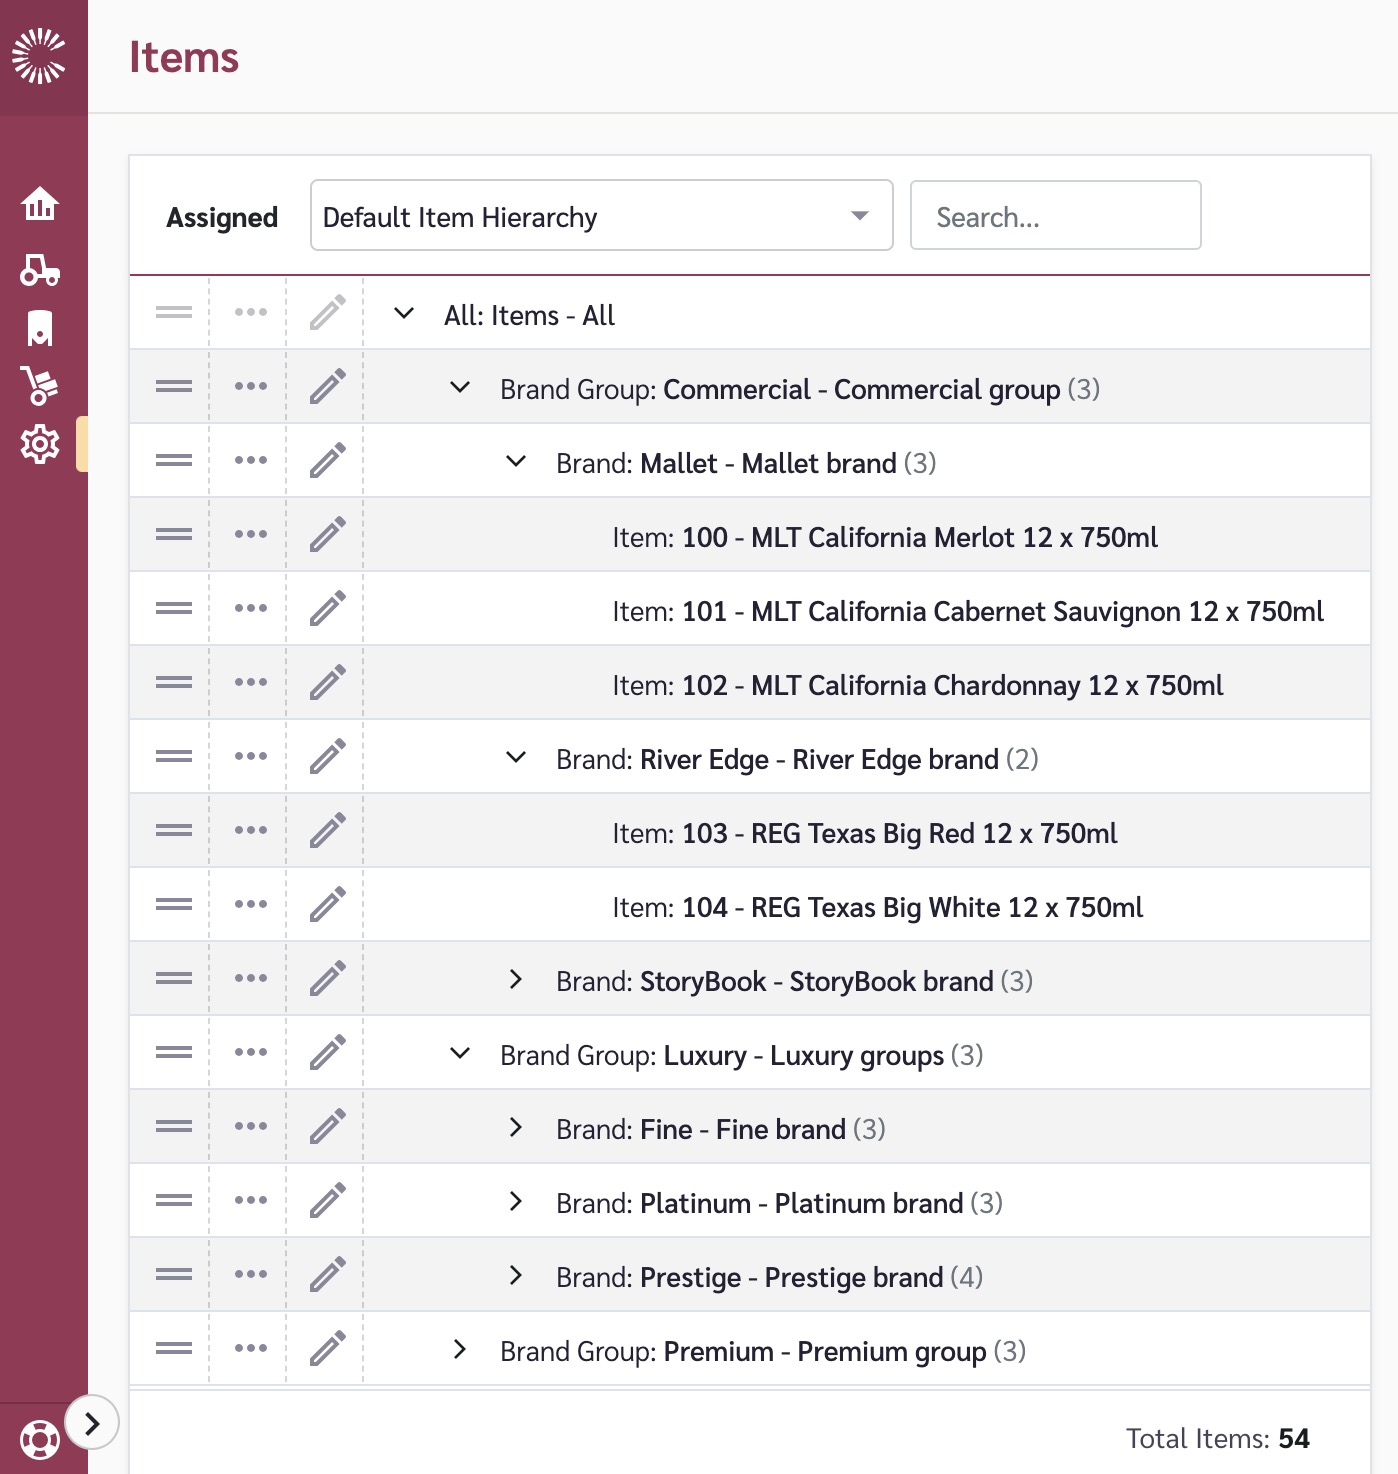
Hierarchies define how data is organized and grouped in Claret. They let you view data at different levels of detail — from a high-level summary down to individual items or customers.

Claret uses several hierarchy types:

| Hierarchy Type               | What It Organizes                                     | Example                                               |
| ---------------------------- | ----------------------------------------------------- | ----------------------------------------------------- |
| **Item Hierarchy**           | Your products (finished goods, WIP items, crop items) | All Wine > Red > Pinot Noir > 2022 Pinot Noir         |
| **Customer Group Hierarchy** | Your customers and distribution channels              | All Customers > Domestic > Retail > ABC Wines         |
| **Crop Location Hierarchy**  | Your growing regions and vineyards (Farm modules)     | All Regions > Marlborough > Estate Vineyard > Block A |

Each hierarchy has **levels**. When you select a higher level, you see aggregated data for everything beneath it. When you drill down to a lower level, you see more granular data.

Different modules use different hierarchy structures. For example, Sell modules typically use Item and Customer Group hierarchies, while Farm modules use Crop Location hierarchies. Your admin sets up the hierarchy structures that are appropriate for your organization.

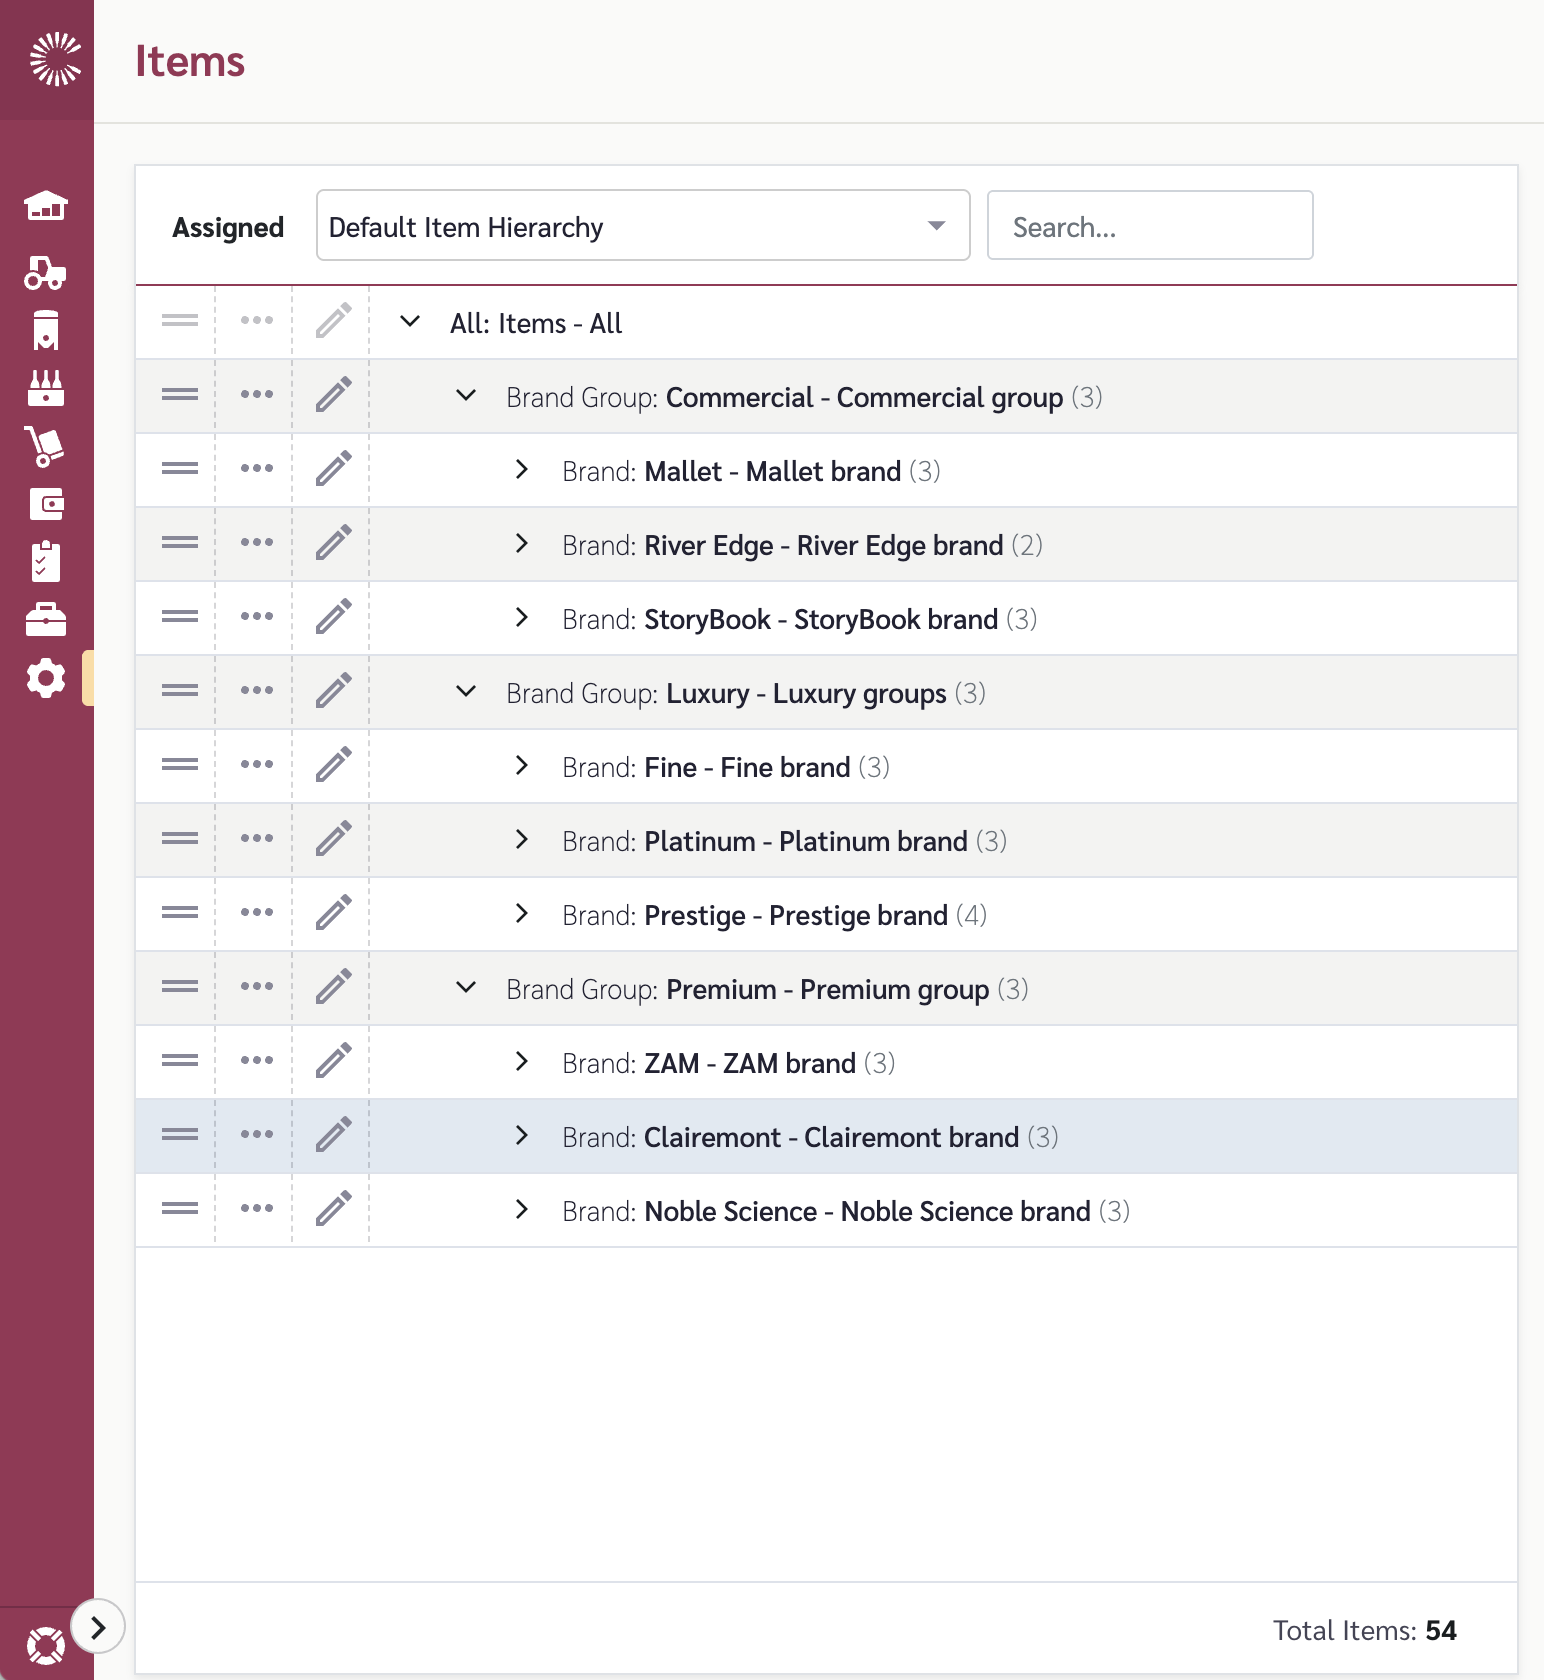
<figure><img src="/files/-Mid4lcdv1bRbx64E51Q" alt=""><figcaption><p>[Screenshot placeholder: example of an Item hierarchy with expanded and collapsed levels]</p></figcaption></figure>

{% hint style="info" %}
Hierarchies affect what you see in views. If your view is configured with a particular Item Hierarchy type, you'll only see items organized within that hierarchy structure.
{% endhint %}

## Views

Views control what data you see and how it's displayed in each module. A view is a saved configuration that defines the columns, time periods, filters, layout and data types for a module page.

There are two types of views:

* **Workspace views** — set up by your admin and available to all users. These are marked with a "(w)" after the name. Start with these when you're new.
* **Personal views** — created by you for your own use. Only you can see your personal views.

Each module has its own views. A view you create in Sales Collaboration won't appear in Make Planning.

To switch views, click the view name in the top-right of the page and select a different one from the dropdown. To create or edit views, use the Configure option in the view menu.

<figure><img src="/files/4O1mBwMFkSANO4fdXFHR" alt=""><figcaption><p>The view selector in the top-right of a module page</p></figcaption></figure>

For more on working with views, see [Managing Views](/using-claret/getting-started/managing-views).

## Calendars and Time Periods

Calendars in Claret define your fiscal year structure and determine how time periods appear in grids and charts.

Key calendar concepts:

* **Fiscal Year** — your organization's financial year. This may not match the calendar year (e.g., your fiscal year might run April to March).
* **Calendar Definitions** — specify the start and end dates for each fiscal year. Your admin configures these.
* **Timing Intervals** — some modules let you view data in weekly or monthly buckets. The interval is configured per view or per forecast configuration.

When you select a calendar in a view, it determines which time periods (columns) appear in the grid. Different views can use different calendars, letting you compare data across fiscal years.

{% hint style="info" %}
Default calendars are set up for new Claret tenants. Your admin may have adjusted them to match your organization's fiscal year. Check with your admin if the dates look unexpected.
{% endhint %}

## Sale Types and Supply Types

Claret categorizes the data flowing through your supply chain into two broad families: **sale types** on the demand side and **supply types** on the supply side. These categories are how Claret keeps different streams of data separate, comparable, and ready to flow between modules.

### Sale Types

A **sale type** labels a stream of demand data so Claret knows what it represents and how to treat it. Each row of sales data in a Sell module belongs to a sale type.

Common sale types fall into a few groups:

* **History / Actuals** — what actually happened, such as real shipments or invoiced sales.
* **Forecast** — projected future demand, whether generated statistically in the Forecast Workbench or entered manually.
* **Plan / Budget** — user-entered targets and commitments, such as an annual budget or agreed sales plan.

In modules like Sales Collaboration and Long Term Planning, you configure views to show separate rows for different sale types. This lets you compare, for example, your budget against actual history and forecasted sales side by side. Sale types are also the connector that links demand data across the Sell modules — a forecast created in one place can be referenced consistently elsewhere because it carries the same sale type.

### Supply Types

A **supply type** is the supply-side equivalent: it labels a stream of supply data so Claret knows what it represents. Supply types describe things planned or actual production and incoming shipments, and they are used by the Make, Pack, and Farm modules.

Just as sale types let you compare different views of demand, supply types let you compare different views of supply — for instance, planned production against actual production, or available inventory against a supply plan.

## Reconciliation

Reconciliation is the process by which data entered at a higher hierarchy level flows down to the detail level. This is a key concept in Sales Collaboration and Long Term Planning.

**How it works:** If you enter a sales plan at the "All Domestic" customer group level, Claret distributes that quantity down to the individual customer groups beneath it, proportionally based on existing data patterns or evenly if no pattern exists.

<figure><img src="/files/-Mkhj2e4_KMBDQbO9sM2" alt=""><figcaption><p>Simple example showing how reconciliation works in Sales Collaboration (and Long Term Planning)</p></figcaption></figure>

This allows different team members to plan at the level that makes sense for them:

* A sales manager might enter forecasts at the regional level
* A supply chain planner needs data at the individual Item @ Customer Group level
* Reconciliation bridges the gap, flowing higher-level plans down to the detail level automatically

{% hint style="info" %}
Reconciliation runs automatically when data is saved at a higher hierarchy level. The reconciled values appear at lower levels and are used by downstream modules like Make Planning.
{% endhint %}

## Data Flow Between Modules

Understanding how data moves between modules helps you see how your work fits into the bigger picture:

1. **Sales data** (from Sales Collaboration, Forecast Workbench, or Long Term Planning) represents demand — what your organization expects to sell.
2. **Make Planning** takes that demand data and combines it with inventory and recipes to determine what needs to be produced. Recipes define how finished goods are made from work-in-process (WIP) items.
3. **Crop Supply Planning** takes Make Planning's production requirements and uses recipes to determine what raw materials (crops) are needed and whether supply meets demand.
4. **Inventory Workbench** modules sit alongside this flow — Inventory Workbench - Partner tracks inventory at partner (distributor) locations using sales forecasts and shipment data, while Inventory Workbench - Internal tracks inventory at your own locations using supply plans and production data.

## Deltas and Variance

Several modules display calculated differences to help you identify gaps between supply and demand.

These variance indicators help planners identify where action is needed — whether that's adjusting production plans, revising forecasts, or sourcing additional supply.


# Global Settings

Review the foundational data that's been set up for you in Claret — calendars, hierarchies, units of measure, varietals, and vintages. Understand which settings apply to your modules.

There are a number of initial data items that we have set up for you in order to get you started quickly. Before diving into module-specific setup, it's worth reviewing these global settings to understand what's already in place and make any adjustments needed for your organization.

{% hint style="info" %}
**Already set up for you:** Claret seeds foundational data for new tenants, including Calendars, Varietals, Vintages, and default Hierarchy Structures. The sections below guide you through reviewing and customising this data rather than creating it from scratch.
{% endhint %}

## Calendars

Calendars define the date periods used throughout Claret — financial years, quarters, and other time groupings. All modules use calendars to organize and aggregate data.

**Check:** Navigate to Master Data > Calendars to review the calendars that have been set up for you.

| What to Review       | Where to Find It                                                                                           |
| -------------------- | ---------------------------------------------------------------------------------------------------------- |
| Calendar Definitions | Master Data > Calendars > Calendar Definitions tab — defines how time periods group (FY, H1, H2, Q1-Q4)    |
| Calendars            | Master Data > Calendars > Calendars tab — the specific calendars (e.g., FY25, FY26) with their date ranges |

Ensure your calendars align with your financial/fiscal year definitions. For detailed instructions on creating and editing calendars, see [Calendars](/master-data/calendars).

## Hierarchy Structures

Hierarchies define how you organize your data — items, customer groups, and locations. Different modules use different hierarchy structure types.

**Check:** Navigate to Master Data > Item Hierarchy and Master Data > Customer Group Hierarchy to review the default structures.

### Item Hierarchy Structures

| Structure Type        | Description                                             | Used By                                                                                           |
| --------------------- | ------------------------------------------------------- | ------------------------------------------------------------------------------------------------- |
| Finished Goods        | Items you sell (bottles, cases, SKUs)                   | Sales Collaboration, Long Term Planning, Forecast Workbench, Make Planning, Inventory Workbenches |
| Work in Process (WIP) | Intermediate items used in production (e.g., bulk wine) | Make Planning                                                                                     |
| Raw Materials         | Input items (e.g., grapes, crop items)                  | Crop Supply Planning                                                                              |

### Customer Group Hierarchy

Customer Groups represent who you sell to — distributors, retailers, regions, or market segments. The Customer Group Hierarchy allows you to organize these into a structure for planning at different levels.

**Check:** Navigate to Master Data > Customer Group Hierarchy to review the default structure.

### Crop Location Hierarchy

The Crop Location Hierarchy defines how your crop/vineyard locations are organized — for example, by region, sub-region, and vineyard block. This is used by Crop Supply Planning.

**Check:** Navigate to Master Data > Crop Location Hierarchy to review the default structure that has been set up for you.

For detailed instructions on setting up hierarchies, see [Item Hierarchy](/master-data/item-hierarchy), [Customer Group Hierarchy](/master-data/customer-group-hierarchy), and [Crop Location Hierarchy](/master-data/crop-location-hierarchy).

## Varietals and Vintages (Make Module)

If you're using the Make Planning module, you'll need Varietals and Vintages configured.

| Data      | Description                                          | Claret Page             |
| --------- | ---------------------------------------------------- | ----------------------- |
| Varietals | Wine varietals you make (e.g., Chardonnay, Cabernet) | Master Data > Varietals |
| Vintages  | The vintage years you're planning for                | Master Data > Vintages  |

**Check:** Navigate to Master Data > Varietals and Master Data > Vintages to review the initial data set up for you. Add or modify as needed for your business.

For more details, see [Varietals](/master-data/varietals) and [Vintages](/master-data/vintages).

## Which Settings Do I Need?

The following table shows which global settings apply to each module:

| Module                         | Calendars | Item Hierarchy       | Customer Group Hierarchy | Crop Location Hierarchy | Varietals | Vintages |
| ------------------------------ | --------- | -------------------- | ------------------------ | ----------------------- | --------- | -------- |
| Sales Collaboration            | ✓         | Finished Goods       | ✓                        |                         |           |          |
| Long Term Planning             | ✓         | Finished Goods       | ✓                        |                         |           |          |
| Forecast Workbench             | ✓         | Finished Goods       | ✓                        |                         |           |          |
| Inventory Workbench - Partner  | ✓         | Finished Goods       | ✓                        |                         |           |          |
| Inventory Workbench - Internal | ✓         | Finished Goods       | ✓                        |                         |           |          |
| Make Planning                  | ✓         | Finished Goods + WIP | ✓                        |                         | ✓         | ✓        |
| Crop Supply Planning           | ✓         | WIP + Raw Materials  |                          | ✓                       | ✓         | ✓        |

Once you've reviewed your global settings, proceed to the setup guide for your specific module(s).


# Setting up Modules

Overview of master data requirements for each Claret module. Links to module-specific setup guides and quick reference for data dependencies.

This page provides a quick reference of the master data required for each module. For guided setup instructions, use the module-specific setup guides below.

## Module Setup Guides

We recommend using these guides to set up each module — they include prerequisites, verification steps, and common questions:

| Module                         | Setup Guide                                                                                                                           |
| ------------------------------ | ------------------------------------------------------------------------------------------------------------------------------------- |
| Sales Collaboration            | [Setting Up Sales Collaboration](/using-claret/getting-started/setting-up-modules/setting-up-sales-collaboration)                     |
| Long Term Planning             | [Setting Up Long Term Planning](/using-claret/getting-started/setting-up-modules/setting-up-long-term-planning)                       |
| Forecast Workbench             | [Setting Up Forecast Workbench](/using-claret/getting-started/setting-up-modules/setting-up-forecast-workbench)                       |
| Inventory Workbench - Partner  | [Setting Up Inventory Workbench - Partner](/using-claret/getting-started/setting-up-modules/setting-up-inventory-workbench-partner)   |
| Inventory Workbench - Internal | [Setting Up Inventory Workbench - Internal](/using-claret/getting-started/setting-up-modules/setting-up-inventory-workbench-internal) |
| Make Planning                  | [Setting Up Make Planning](/using-claret/getting-started/setting-up-modules/setting-up-make-planning)                                 |
| Crop Supply Planning           | [Setting Up Crop Supply Planning](/using-claret/getting-started/setting-up-modules/setting-up-crop-supply-planning)                   |

## Master Data Quick Reference

The following table shows which master data is required for each module category. Use this as a checklist when setting up multiple modules.

<table><thead><tr><th width="73" data-type="number"></th><th width="180">Data</th><th width="280">Description</th><th width="70">Sell</th><th width="70">Pack</th><th width="70">Make</th><th width="70">Farm</th><th data-type="content-ref"></th></tr></thead><tbody><tr><td>1</td><td>Finished Goods Items</td><td>Set up the items you sell</td><td>✓</td><td>✓</td><td>✓</td><td></td><td><a href="/pages/-MicZ2DF9n3leulvN_wf">/pages/-MicZ2DF9n3leulvN_wf</a></td></tr><tr><td>2</td><td>Customer Groups</td><td>Set up the customers you sell to</td><td>✓</td><td>✓</td><td>✓</td><td></td><td><a href="/pages/-MjH1Z0pQxBFni7zHSl4">/pages/-MjH1Z0pQxBFni7zHSl4</a></td></tr><tr><td>3</td><td>Item @ Customer Groups</td><td>Connect which items are sold to which customers</td><td>✓</td><td>✓</td><td>✓</td><td></td><td><a href="/pages/HXp2waWaEs18dKRds026">/pages/HXp2waWaEs18dKRds026</a></td></tr><tr><td>4</td><td>Sale Types</td><td>Set up the types of sale data you wish to capture</td><td>✓</td><td>✓</td><td>✓</td><td></td><td><a href="/pages/-MkIT2v3cqjNGdV0o1Rs">/pages/-MkIT2v3cqjNGdV0o1Rs</a></td></tr><tr><td>5</td><td>Locations</td><td>Set up the locations you make and store products</td><td>IW only</td><td>✓</td><td>✓</td><td>✓</td><td><a href="/pages/2sOHbCz33DxdFYZoNTBB">/pages/2sOHbCz33DxdFYZoNTBB</a></td></tr><tr><td>6</td><td>Item @ Locations</td><td>Connect items to locations</td><td>IW only</td><td>✓</td><td>✓</td><td>✓</td><td><a href="/pages/M48EPQEKmIUOHNxqGjic">/pages/M48EPQEKmIUOHNxqGjic</a></td></tr><tr><td>7</td><td>Supply and Demand Map</td><td>Connect Item @ Customer Groups to Item @ Locations</td><td>IW only</td><td>✓</td><td></td><td></td><td><a href="/pages/4H3X6nGniWQ3ZsxdYl4F">/pages/4H3X6nGniWQ3ZsxdYl4F</a></td></tr><tr><td>8</td><td>Supply Types</td><td>Set up the different supply plans you wish to plan against</td><td></td><td>✓</td><td>✓</td><td>✓</td><td><a href="/pages/oXTA9Lz4TdmbUPIIwQzL">/pages/oXTA9Lz4TdmbUPIIwQzL</a></td></tr><tr><td>9</td><td>Varietals</td><td>Add the varietals of beverages that you make</td><td></td><td></td><td>✓</td><td>✓</td><td><a href="/pages/qIE8D5j09k3ry1SaPMqP">/pages/qIE8D5j09k3ry1SaPMqP</a></td></tr><tr><td>10</td><td>Vintages</td><td>Add the vintages you are planning for</td><td></td><td></td><td>✓</td><td>✓</td><td><a href="/pages/aBUg7jNybAWecb86y8ho">/pages/aBUg7jNybAWecb86y8ho</a></td></tr><tr><td>11</td><td>Routings</td><td>Set up aging processes and timeframes for WIP items</td><td></td><td></td><td>✓</td><td></td><td><a href="/pages/rZmd6NbCqs0Kbvi86HWz">/pages/rZmd6NbCqs0Kbvi86HWz</a></td></tr><tr><td>12</td><td>WIP Items</td><td>Set up work in process / bulk wine items</td><td></td><td></td><td>✓</td><td>✓</td><td><a href="/pages/lOxn5ry36Cu9zuLlIqVh">/pages/lOxn5ry36Cu9zuLlIqVh</a></td></tr><tr><td>13</td><td>Recipes</td><td>Connect WIP items to finished goods (and WIP to crop items)</td><td></td><td></td><td>✓</td><td>✓</td><td><a href="/pages/J5mk4spIevsvS2ixoweS">/pages/J5mk4spIevsvS2ixoweS</a></td></tr><tr><td>14</td><td>Crop Locations</td><td>Set up crop/vineyard locations</td><td></td><td></td><td></td><td>✓</td><td><a href="/pages/wBg9Y4KS7Z93W8vZ4tJM">/pages/wBg9Y4KS7Z93W8vZ4tJM</a></td></tr><tr><td>15</td><td>Crop Items</td><td>Set up raw material items (e.g., grape varieties)</td><td></td><td></td><td></td><td>✓</td><td><a href="/pages/7Pk60xd9eOLdV6MWpqCP">/pages/7Pk60xd9eOLdV6MWpqCP</a></td></tr><tr><td>16</td><td>Application Settings</td><td>Module-specific settings</td><td>✓</td><td>✓</td><td>✓</td><td>✓</td><td><a href="/pages/sAfVR9qxrY7YAgJpSTjh">/pages/sAfVR9qxrY7YAgJpSTjh</a></td></tr></tbody></table>

**Legend:**

* **Sell** = Sales Collaboration, Long Term Planning, Forecast Workbench, Inventory Workbench - Partner
* **Pack** = Inventory Workbench - Internal
* **Make** = Make Planning
* **Farm** = Crop Supply Planning
* **IW** = Inventory Workbenches only (not Sales Collaboration, LTP, or Forecast Workbench)
* **FW** = Forecast Workbench only

## Combined Setup Paths

If you're setting up multiple modules, here's what to expect:

### Sell Modules Only (Sales Collaboration + Long Term Planning + Forecast Workbench)

All three Sell modules share the same core data (Items, Customer Groups, Item @ Customer Groups, Sale Types). Set up one and the others require minimal additional configuration.

### Sell + Inventory Workbenches

If adding Inventory Workbenches to an existing Sell setup, you'll need to add:

* Locations
* Item @ Locations
* Supply and Demand Map
* Supply Types (for IW-Internal)

### Make + Farm

Make Planning and Crop Supply Planning work together. Make Planning should be set up first — Crop Supply Planning derives its demand from WIP production plans via Recipes.

### All Modules

If setting up all modules, start with Sell modules (easiest), then add Make Planning, then Crop Supply Planning, then Inventory Workbenches.

## Adding a Module Later

If you've already been using Claret and are adding a new module:

* **Most master data is shared** — Items, Customer Groups, and Item @ Customer Groups are used across multiple modules
* **Check what's already done** — The module setup guides indicate which data you may have already configured
* **New data is usually module-specific** — For example, adding Make requires WIP Items, Routings, and Recipes that aren't used by Sell modules

## Bulk Import Files

As you work through the setup, there are template files you can use to load data in bulk. These templates are available on the relevant master data pages in Claret.


# Setting Up Sales Collaboration

Step-by-step setup guide for Sales Collaboration in Claret. Covers prerequisites, required master data, and verification steps for admin users.

Sales Collaboration allows people across your organization to participate in creating a sales plan at any level in the Item and Customer Group hierarchies. Through reconciliation, quantities entered at higher levels flow down to the lowest-level Item @ Customer Group in the Sales data.

## What's Already Set Up

Claret seeds some data for new tenants. Before starting, check what already exists:

* **Calendars** — Default calendars and calendar definitions have been created. Review at Master Data > Calendars.
* **Hierarchy Structures** — Default Finished Goods Item Hierarchy and Customer Group Hierarchy structures exist. Review at Master Data > Item Hierarchy and Master Data > Customer Group Hierarchy.

## Prerequisites

* Review [Global Settings](/using-claret/getting-started/global-settings) to confirm calendars align with your fiscal year definitions

## Setup Steps

Sales Collaboration requires the following master data to be configured:

| Step | Data                     | Description                                          | Instructions                                                      |
| ---- | ------------------------ | ---------------------------------------------------- | ----------------------------------------------------------------- |
| 1    | Item Hierarchy           | Define how your finished goods are organized         | [Item Hierarchy](/master-data/item-hierarchy)                     |
| 2    | Items                    | The finished goods products you sell                 | [Items](/master-data/items)                                       |
| 3    | Customer Group Hierarchy | Define how your customers are organized              | [Customer Group Hierarchy](/master-data/customer-group-hierarchy) |
| 4    | Customer Groups          | Who you sell to                                      | [Customer Groups](/master-data/customer-groups)                   |
| 5    | Item @ Customer Groups   | Which items are sold to which customers              | [Item @ Customer Groups](/master-data/item-customer-groups)       |
| 6    | Sale Types               | Categories of sales data (Budget, Forecast, History) | [Sale Types](/master-data/sale-types)                             |

{% hint style="success" %}
**Quick Win:** After completing steps 1-5, you can begin entering sales plans. Step 6 (Sale Types) determines what you're planning against, but you can start with the default types.
{% endhint %}

For detailed setup instructions, see the [Sales Collaboration](/sell/sales-collaboration) documentation.

## Loading Data (Optional)

If you have historical and/or existing forecast sales data to import:

1. Go to Settings > Transactional Data > [Sales](/transactional-data/sales)
2. Import sales data against your Item @ Customer Groups and Sale Types

Historical data isn't required to start planning but provides useful context.

## What's Next

* [Using Sales Collaboration](/sell/sales-collaboration/using-sales-collaboration) — day-to-day usage
* [Collaborating on Sales Data](/sell/sales-collaboration/collaborating-on-sales-data) — how reconciliation works

## Verification

To verify Sales Collaboration is set up correctly:

1. Navigate to Sell > Sales Collaboration
2. Configure a view by selecting a Sale Type and Calendar
3. Select your item or customer group level in the top picker
4. Your alternative hierarchy data should appear in a grid
5. You should be able to see, enter and save sales plan data

**If the page is empty:**

* Verify Items have been added to the Finished Goods hierarchy
* Verify Customer Groups have been added
* Verify Item @ Customer Group links exist for those items and customers

## Common Questions

### What sale types do I need?

At minimum, one sale type for the data you want to plan (e.g., "Budget" or "Forecast"). Many organizations also set up a "History" sale type for actual sales data.

### Can I plan at different hierarchy levels?

Yes. Data entered at a higher level reconciles down to the lowest Item @ Customer Group level automatically.


# Setting Up Long Term Planning

Step-by-step setup guide for Long Term Planning in Claret. Covers prerequisites, required master data, and verification steps for admin users.

Long Term Planning allows you to build a demand plan that spans multiple years. You can enter plans at any level in your Item and Customer Group hierarchies, and the data reconciles down to the lowest Item @ Customer Group level via reconciliation.

## What's Already Set Up

Claret seeds some data for new tenants. Before starting, check what already exists:

* **Calendars** — Default calendars and calendar definitions have been created. Review at Master Data > Calendars.
* **Hierarchy Structures** — Default Finished Goods Item Hierarchy and Customer Group Hierarchy structures exist.

## Prerequisites

* Review [Global Settings](/using-claret/getting-started/global-settings) to confirm calendars align with your fiscal year definitions
* If you've already set up Sales Collaboration, most of the master data below is already done

## Setup Steps

Long Term Planning requires the following master data to be configured:

| Step | Data                     | Description                                     | Instructions                                                      |
| ---- | ------------------------ | ----------------------------------------------- | ----------------------------------------------------------------- |
| 1    | Item Hierarchy           | Define how your finished goods are organized    | [Item Hierarchy](/master-data/item-hierarchy)                     |
| 2    | Items                    | The products you sell                           | [Items](/master-data/items)                                       |
| 3    | Customer Group Hierarchy | Define how your customers are organized         | [Customer Group Hierarchy](/master-data/customer-group-hierarchy) |
| 4    | Customer Groups          | Who you sell to                                 | [Customer Groups](/master-data/customer-groups)                   |
| 5    | Item @ Customer Groups   | Which items are sold to which customers         | [Item @ Customer Groups](/master-data/item-customer-groups)       |
| 6    | Sale Types               | Categories of sales data (Budget, LTP, History) | [Sale Types](/master-data/sale-types)                             |

{% hint style="success" %}
**Quick Win:** If you've set up Sales Collaboration, you only need to create additional Sale Types (e.g., "LTP") and ensure you have Calendars for future fiscal years.
{% endhint %}

## Loading Data (Optional)

If you have historical sales data to reference when building long-term plans:

1. Go to Settings > Transactional Data > [Sales](/transactional-data/sales)
2. Import sales data against your Item @ Customer Groups

Historical data enables the Growth % feature, which calculates percentage change between plan years and history.

## What's Next

* [Long Term Planning](/sell/long-term-planning) — detailed usage documentation

## Verification

To verify Long Term Planning is set up correctly:

1. Navigate to Sell > Long Term Planning
2. Click the View button and select Configure
3. Add a new view with your Item Hierarchy, Customer Group Hierarchy, and a Sale Type
4. You should see a grid with your hierarchy levels
5. Select an editable Sale Type and verify you can enter values

**If the page shows no data:**

* Verify Items and Customer Groups exist and are linked via Item @ Customer Groups
* Verify you have at least one Sale Type configured
* Verify you have Calendars set up for the periods you want to plan

## Common Questions

### How does Growth % work?

Growth % compares one Sale Type/Calendar combination against another. For example, you can show FY26 LTP growth compared to FY25 History. Configure this when setting up your view.

### What's the difference between Long Term Planning and Sales Collaboration?

Long Term Planning is designed for annual planning across multiple years, typically at higher hierarchy levels. Sales Collaboration is for more granular, near-term planning. Both store data at the Item @ Customer Group level.


# Setting Up Forecast Workbench

Step-by-step setup guide for Forecast Workbench in Claret. Covers prerequisites, required master data, application settings, and verification steps for admin users.

Forecast Workbench uses statistical models with historical sales data to forecast demand into the future. It uses R modeling techniques and can either automatically select the best model or allow you to choose one manually.

## What's Already Set Up

Claret seeds some data for new tenants. Before starting, check what already exists:

* **Calendars** — Default calendars and calendar definitions have been created.
* **Hierarchy Structures** — Default Finished Goods Item Hierarchy and Customer Group Hierarchy structures exist.

## Prerequisites

* Review [Global Settings](/using-claret/getting-started/global-settings) to confirm calendars and timing intervals are configured
* If you've set up Sales Collaboration, most master data is already done
* **Historical sales data is required** — the statistical models need history to generate forecasts

## Setup Steps

Forecast Workbench requires the following master data to be configured:

| Step | Data                     | Description                                  | Instructions                                                      |
| ---- | ------------------------ | -------------------------------------------- | ----------------------------------------------------------------- |
| 1    | Item Hierarchy           | Define how your finished goods are organized | [Item Hierarchy](/master-data/item-hierarchy)                     |
| 2    | Items                    | The products you forecast                    | [Items](/master-data/items)                                       |
| 3    | Customer Group Hierarchy | Define how your customers are organized      | [Customer Group Hierarchy](/master-data/customer-group-hierarchy) |
| 4    | Customer Groups          | Who you sell to                              | [Customer Groups](/master-data/customer-groups)                   |
| 5    | Item @ Customer Groups   | Which items are sold to which customers      | [Item @ Customer Groups](/master-data/item-customer-groups)       |
| 6    | Sale Types               | History and Forecast types                   | [Sale Types](/master-data/sale-types)                             |

### Application Settings

Forecast Workbench has module-specific settings that must be configured:

1. Go to Settings > Application Maintenance > [Application Settings](/application-maintenance/application-settings)
2. Configure the Forecast Workbench settings, including the default timing interval and forecast parameters

{% hint style="warning" %}
Ensure Application Settings for Forecast Workbench are configured before using the module.
{% endhint %}

## Loading Data (Required)

Forecast Workbench requires historical sales data to generate statistical forecasts:

1. Go to Settings > Transactional Data > [Sales](/transactional-data/sales)
2. Import historical sales data against your Item @ Customer Groups
3. Ensure you have sufficient history for meaningful forecasts (typically 12+ months)

## What's Next

* [Forecast Workbench](/sell/forecast-workbench) — detailed usage and model configuration
* [Forecasting Models](/sell/forecast-workbench/forecasting-models) — understand the available statistical models

## Verification

To verify Forecast Workbench is set up correctly:

1. Navigate to Sell > Forecast Workbench
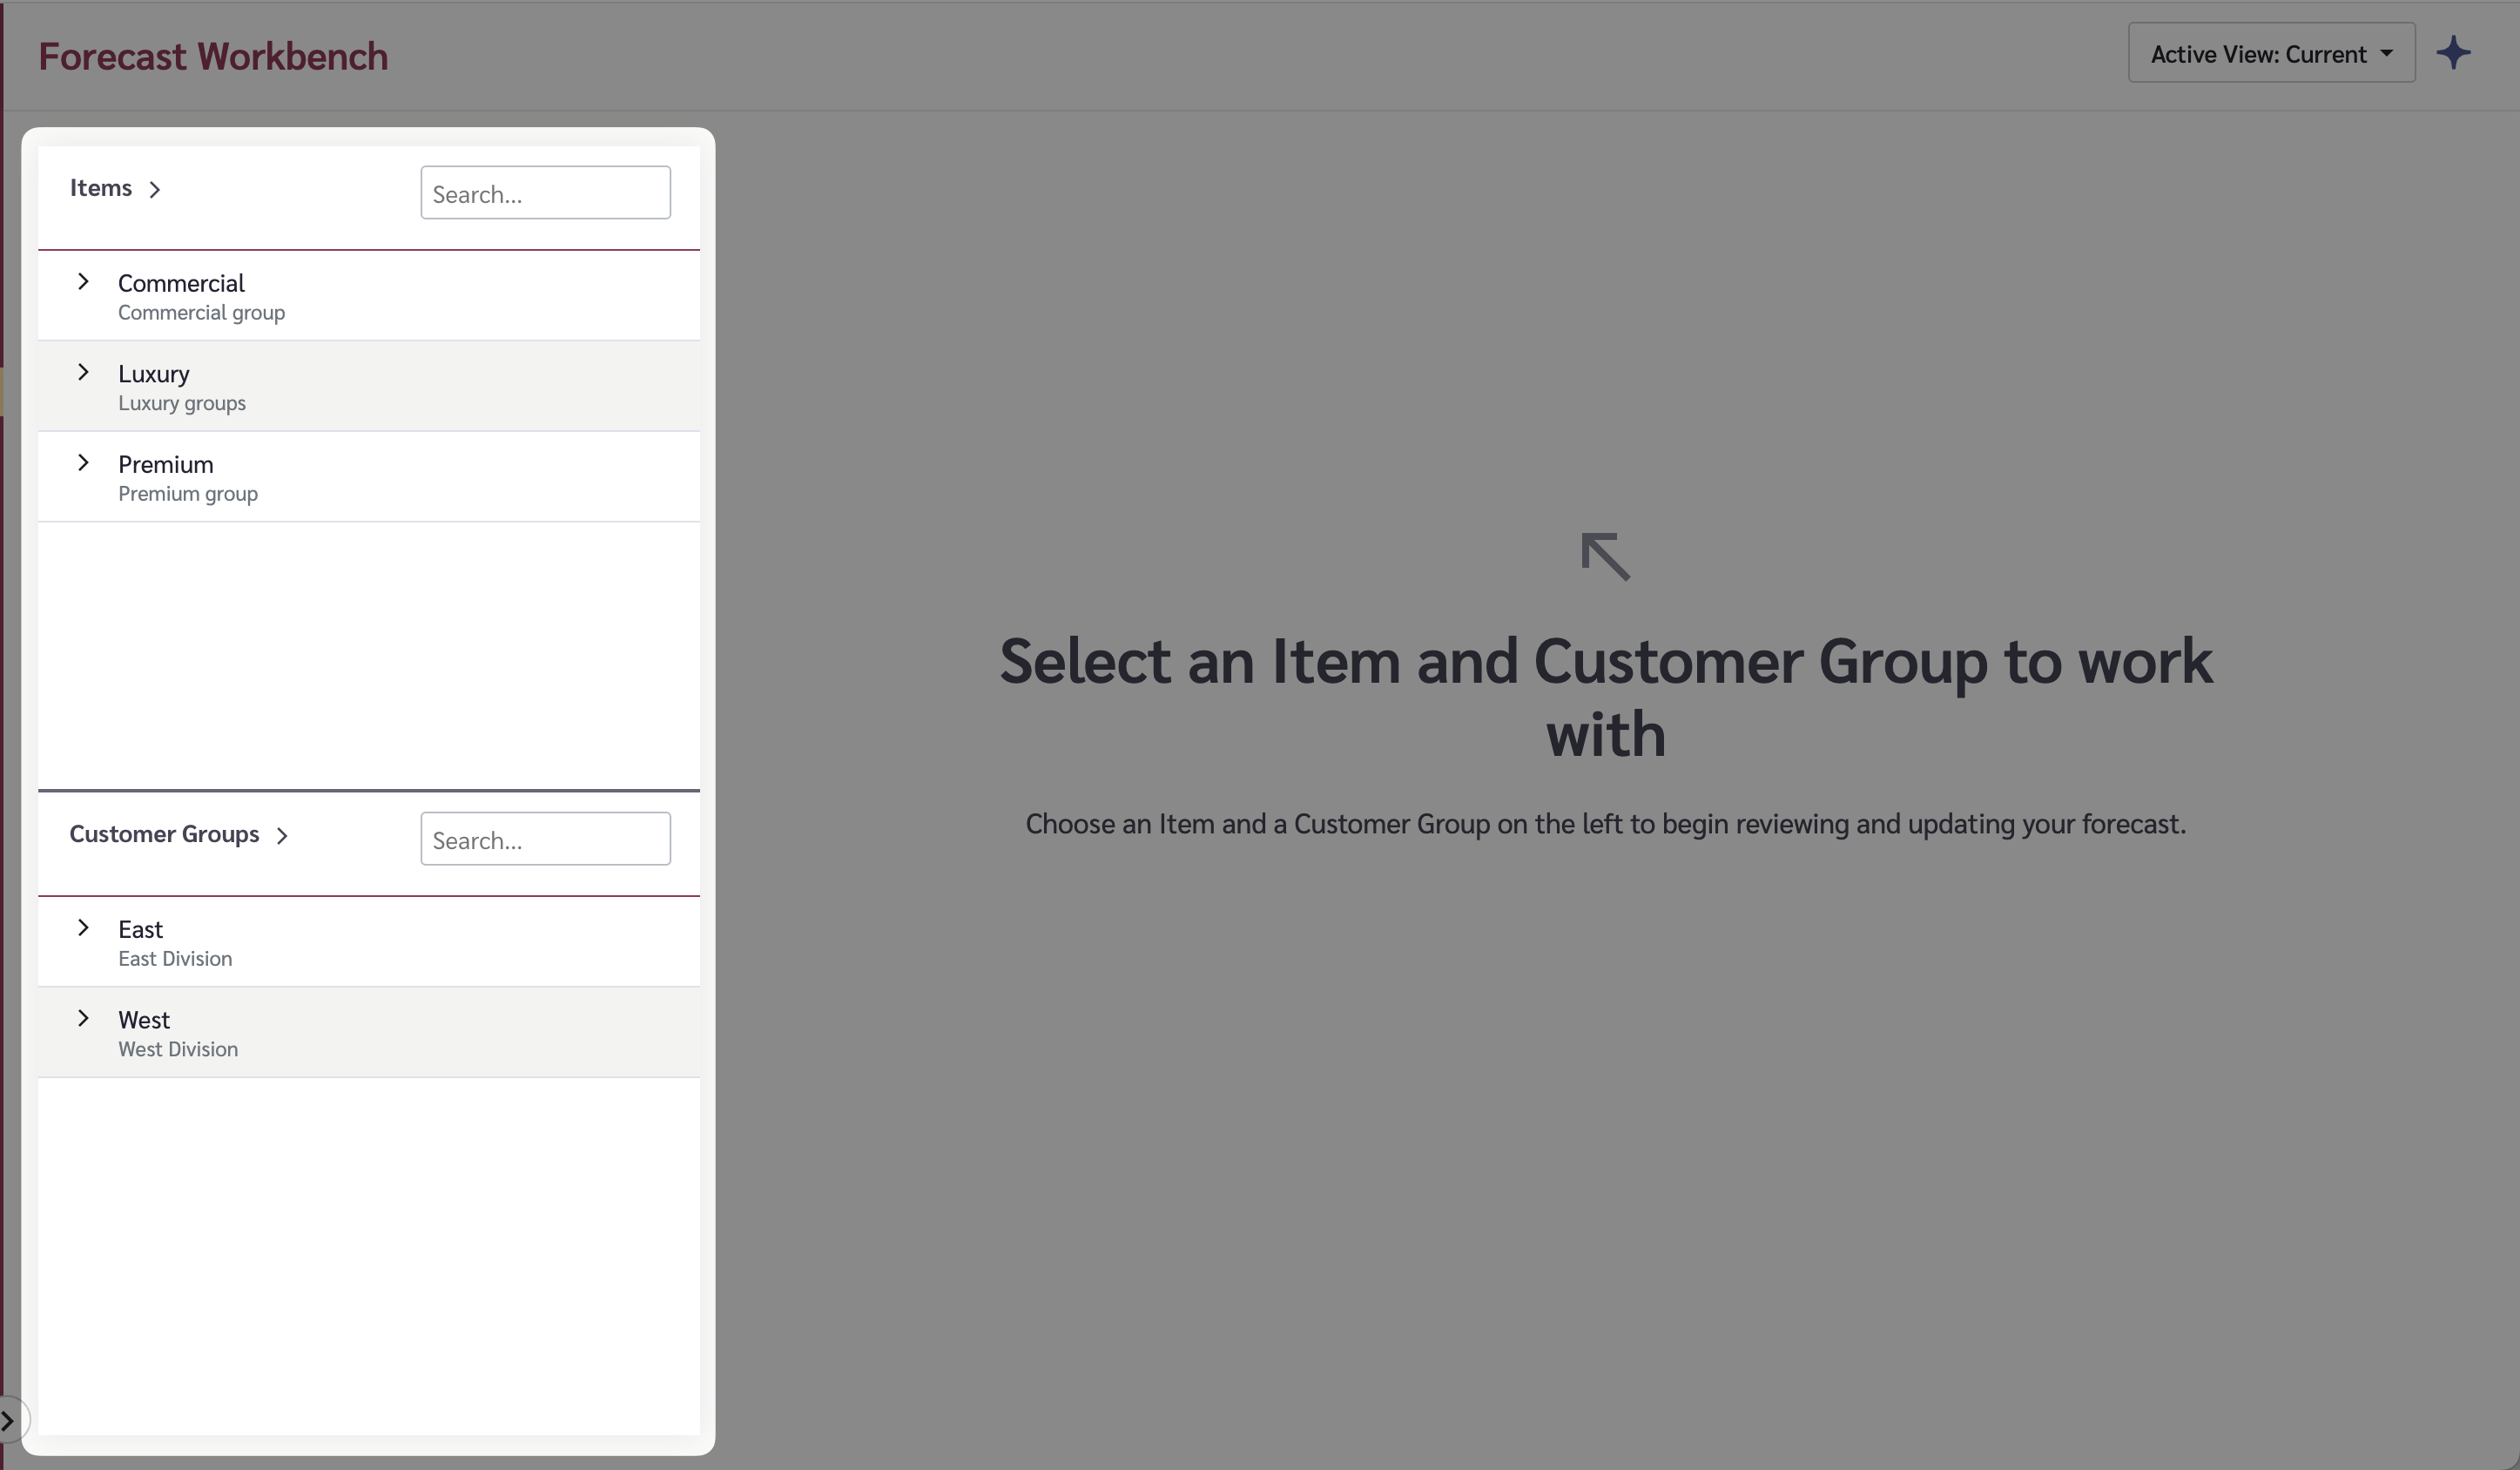
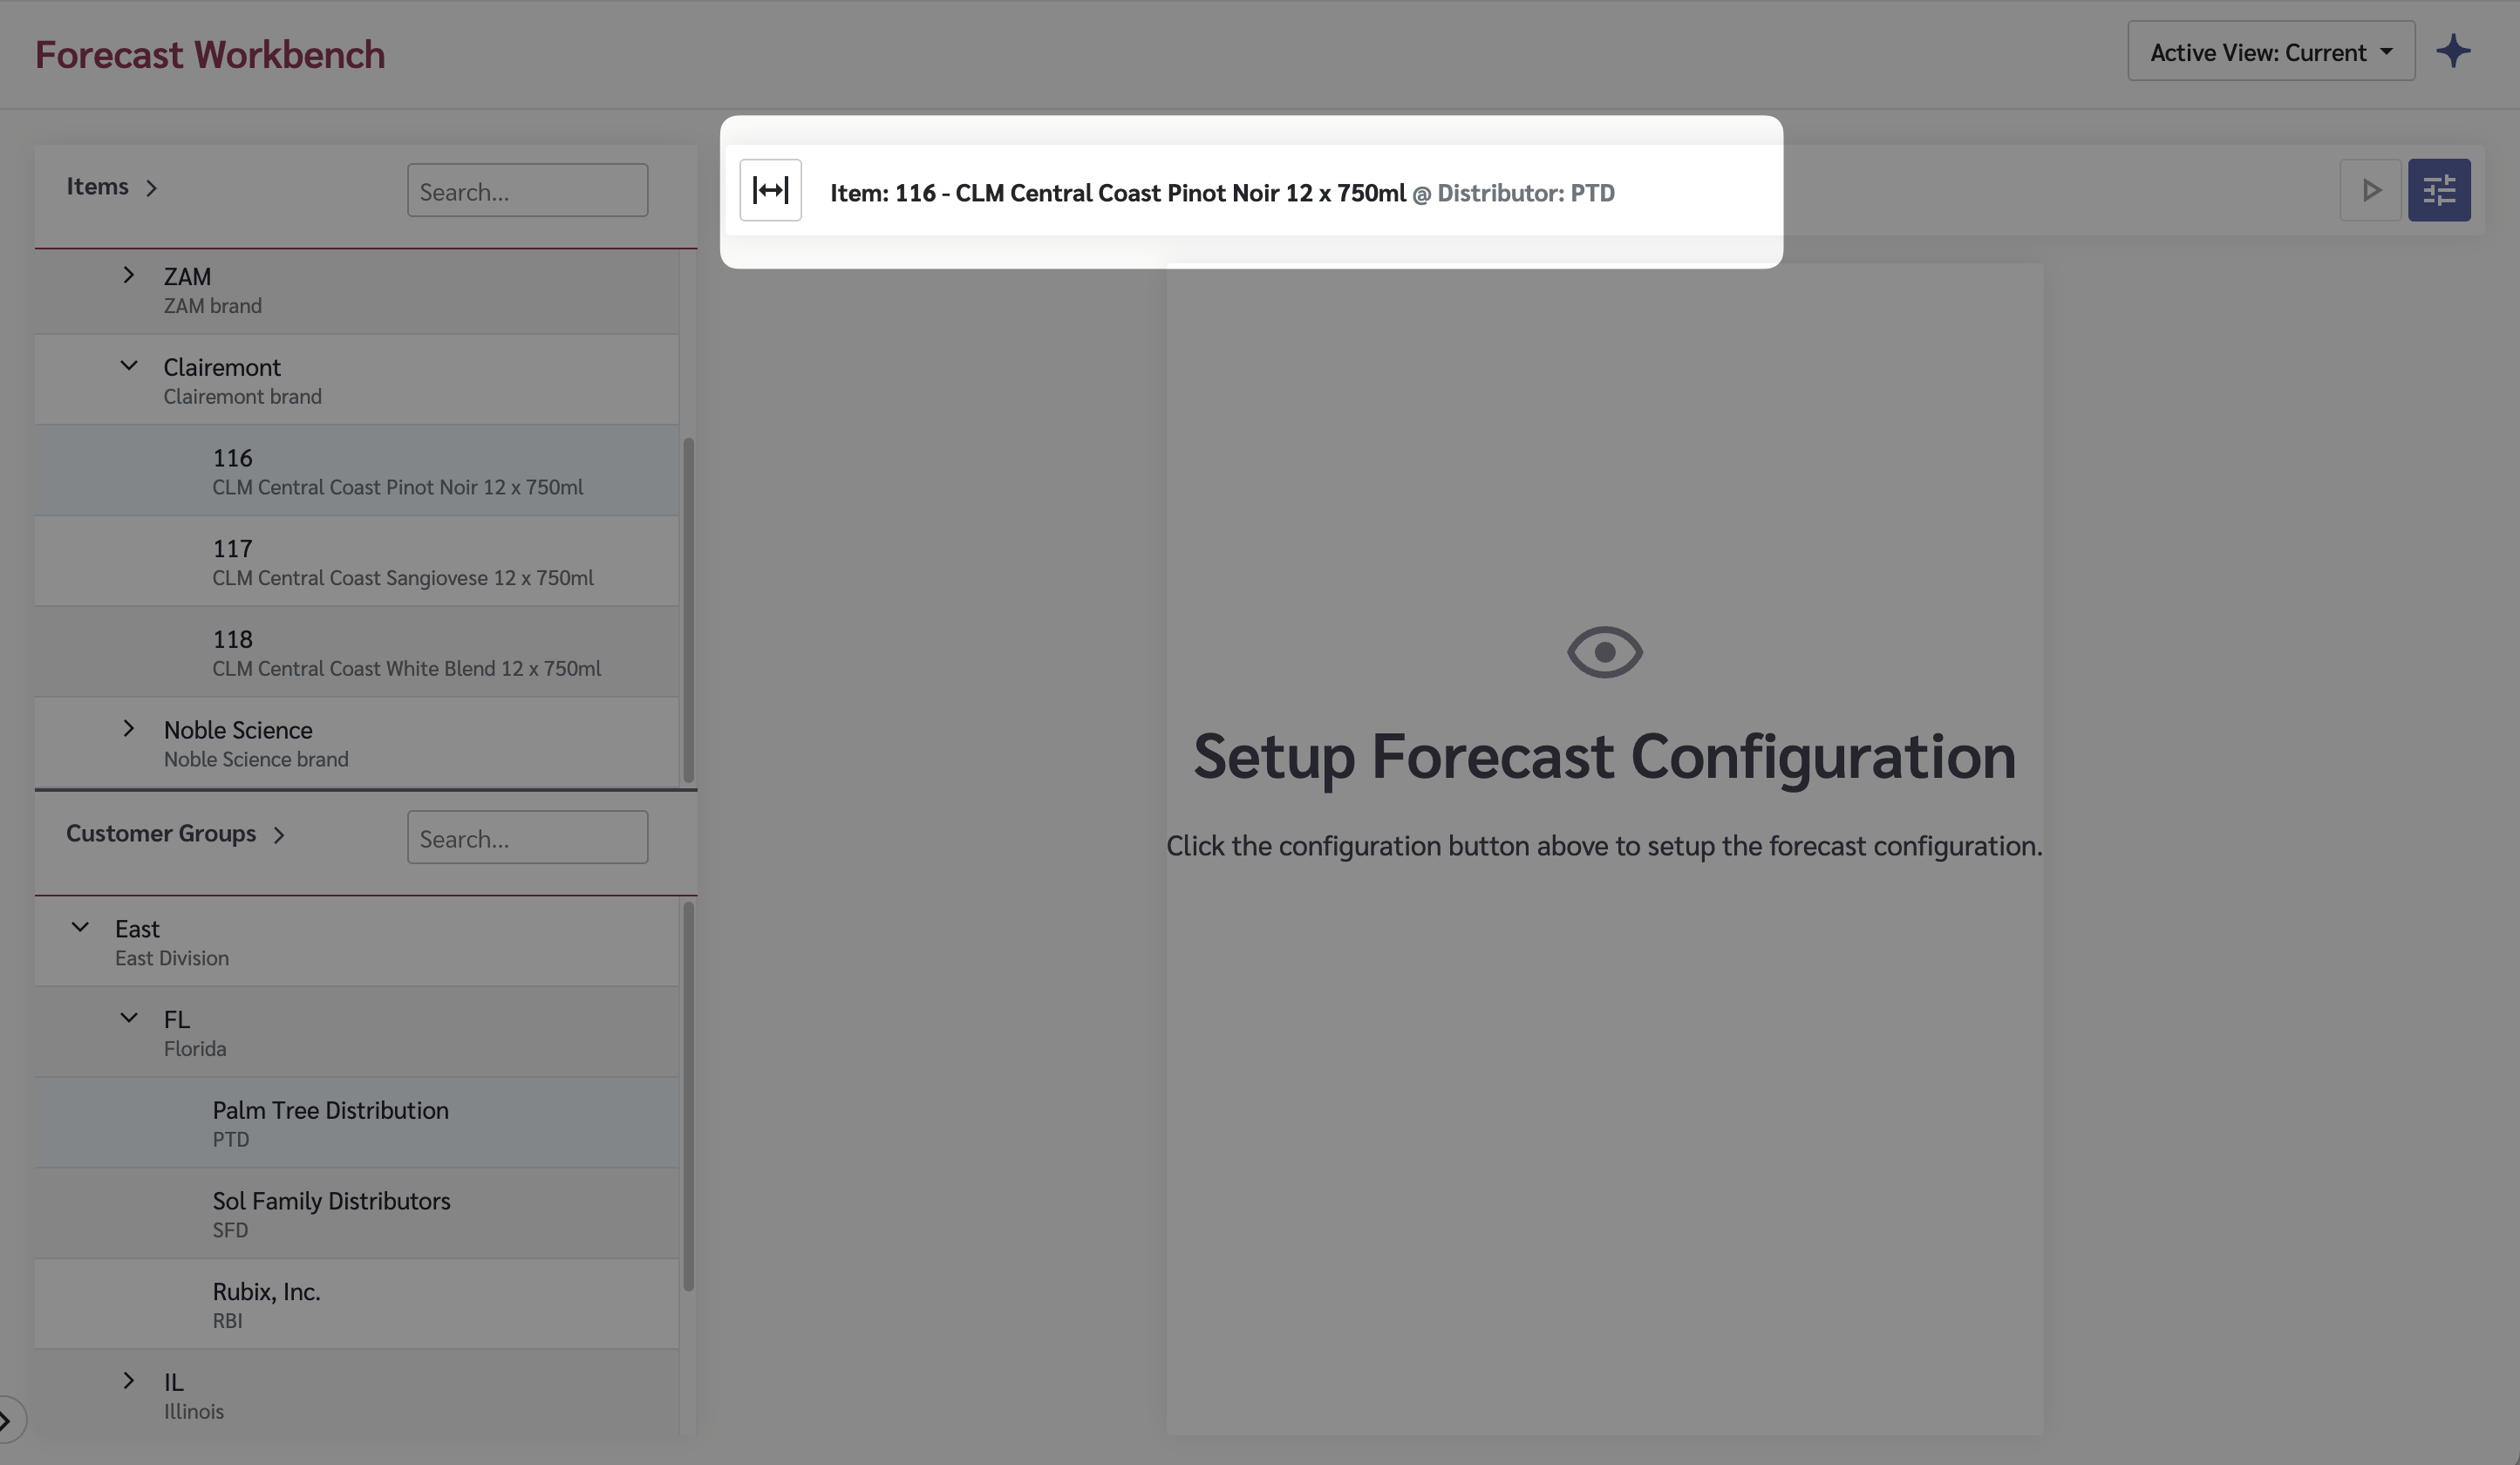
2. You should see your Items and Customer Groups listed on the left
3. Select an Item and Customer Group combination
4. Click the configuration (blue) button to set up forecast parameters
5. Set your timing interval, history date range, and forecast horizon
6. Click the Play button to run the model
7. You should see a chart with history and forecast data

**If no data appears:**

* Verify Item @ Customer Group combinations exist
* Verify historical sales data has been imported
* Verify Application Settings for Forecast Workbench are configured

## Common Questions

### How much history do I need?

More history generally produces better forecasts. We recommend at least 12 months of data, but the models can work with less.

### What if I have gaps in my history?

The Missing Imputation setting in the forecast configuration tells the model how to handle gaps — you can choose to use zeros, averages, or other methods.

### Can I override the statistical forecast?

Yes. After running the model, you can manually override values in the data table below the chart.


# Setting Up Inventory Workbench - Partner

Step-by-step setup guide for Inventory Workbench - Partner in Claret. Covers prerequisites, required master data, and verification steps for admin users.

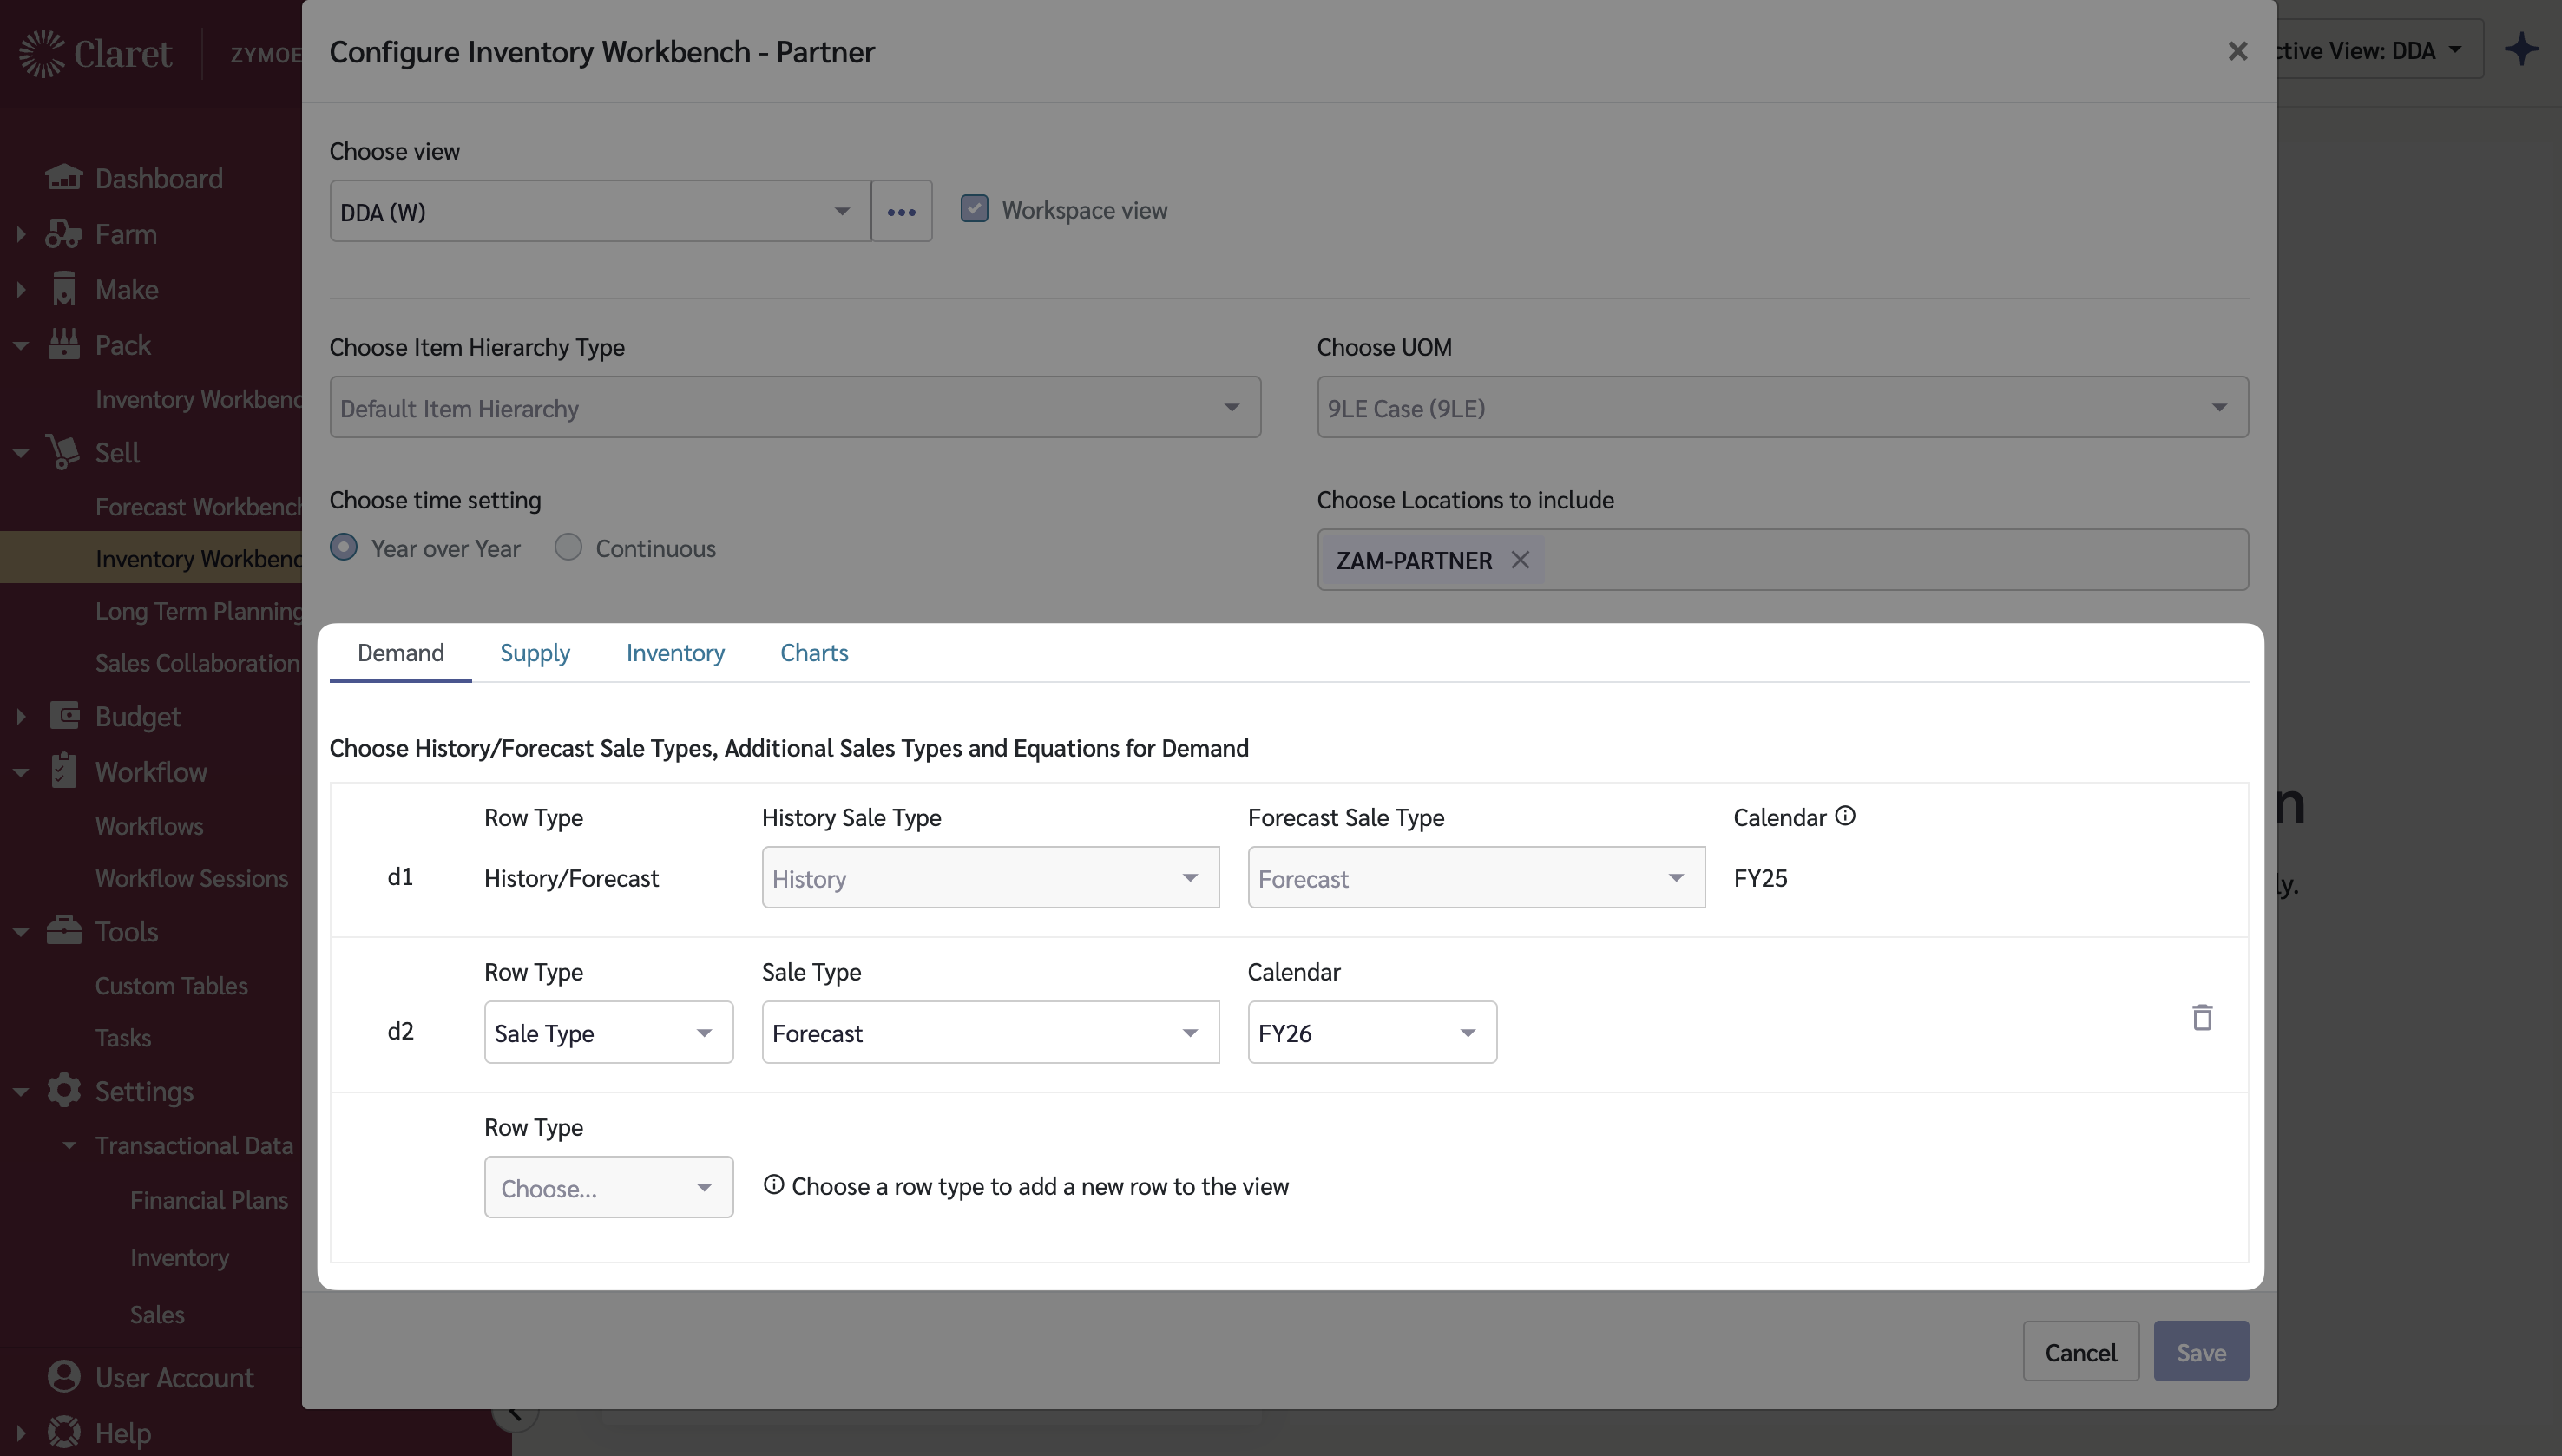
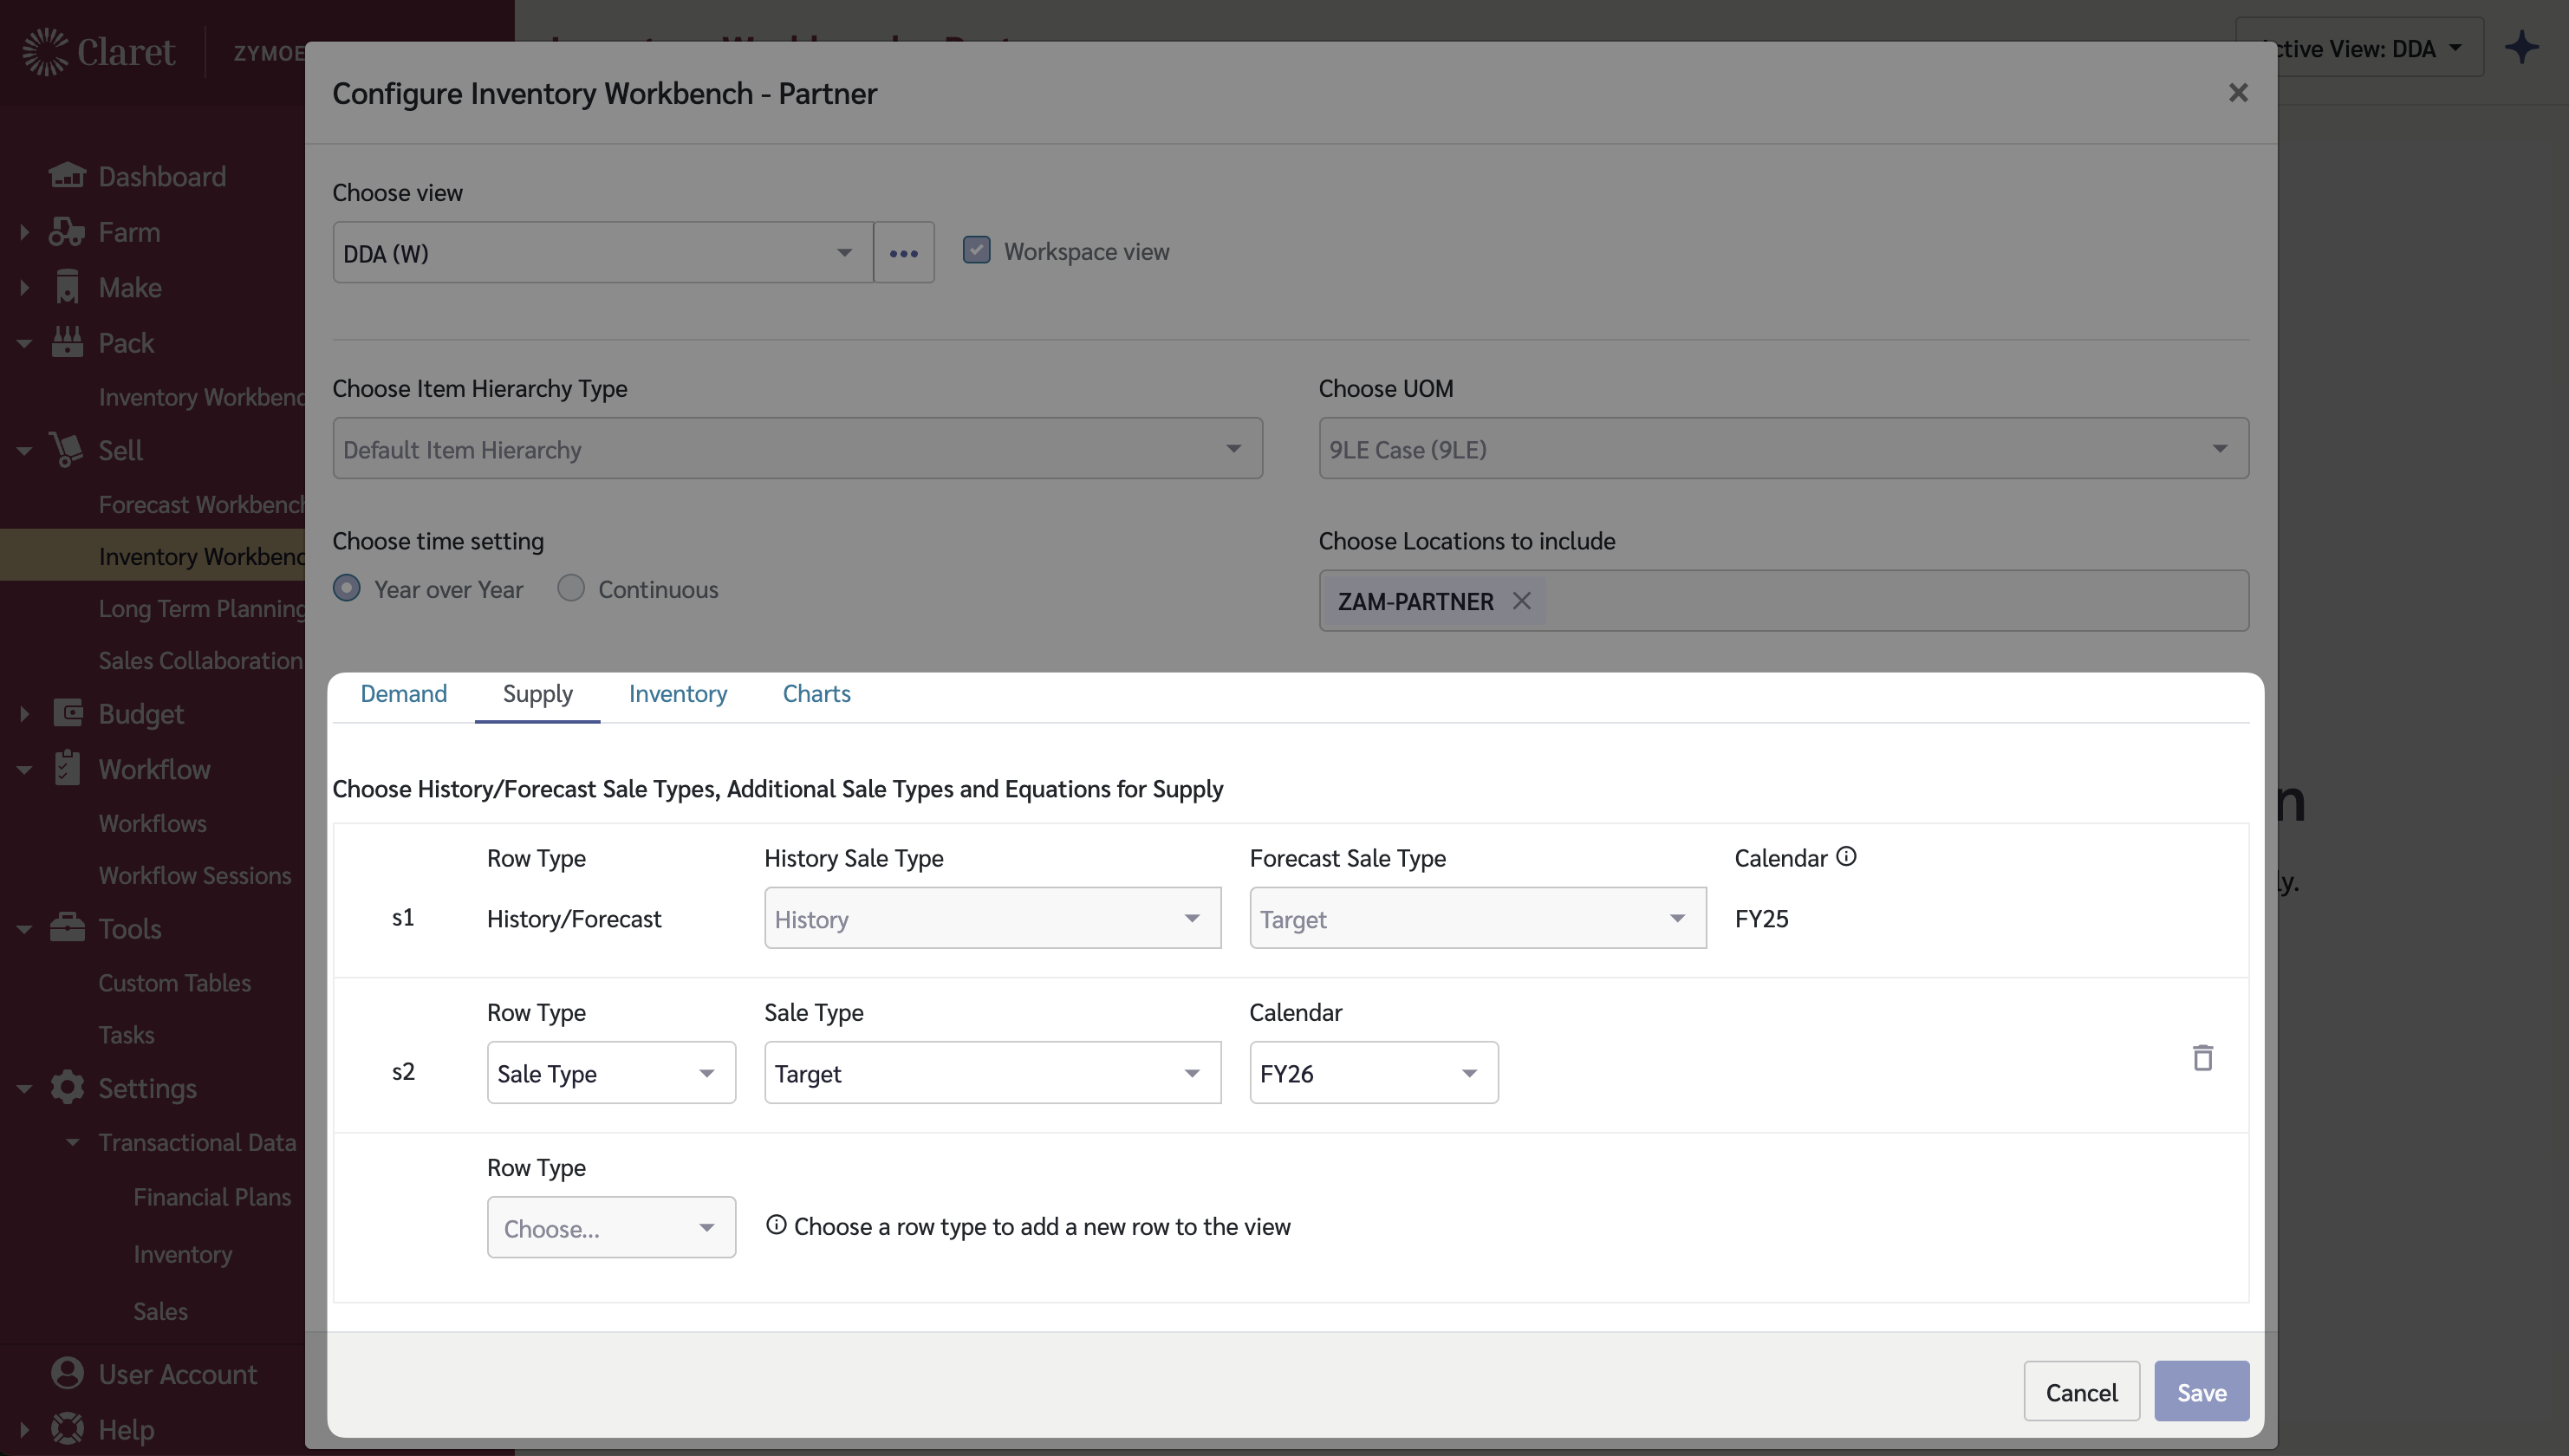
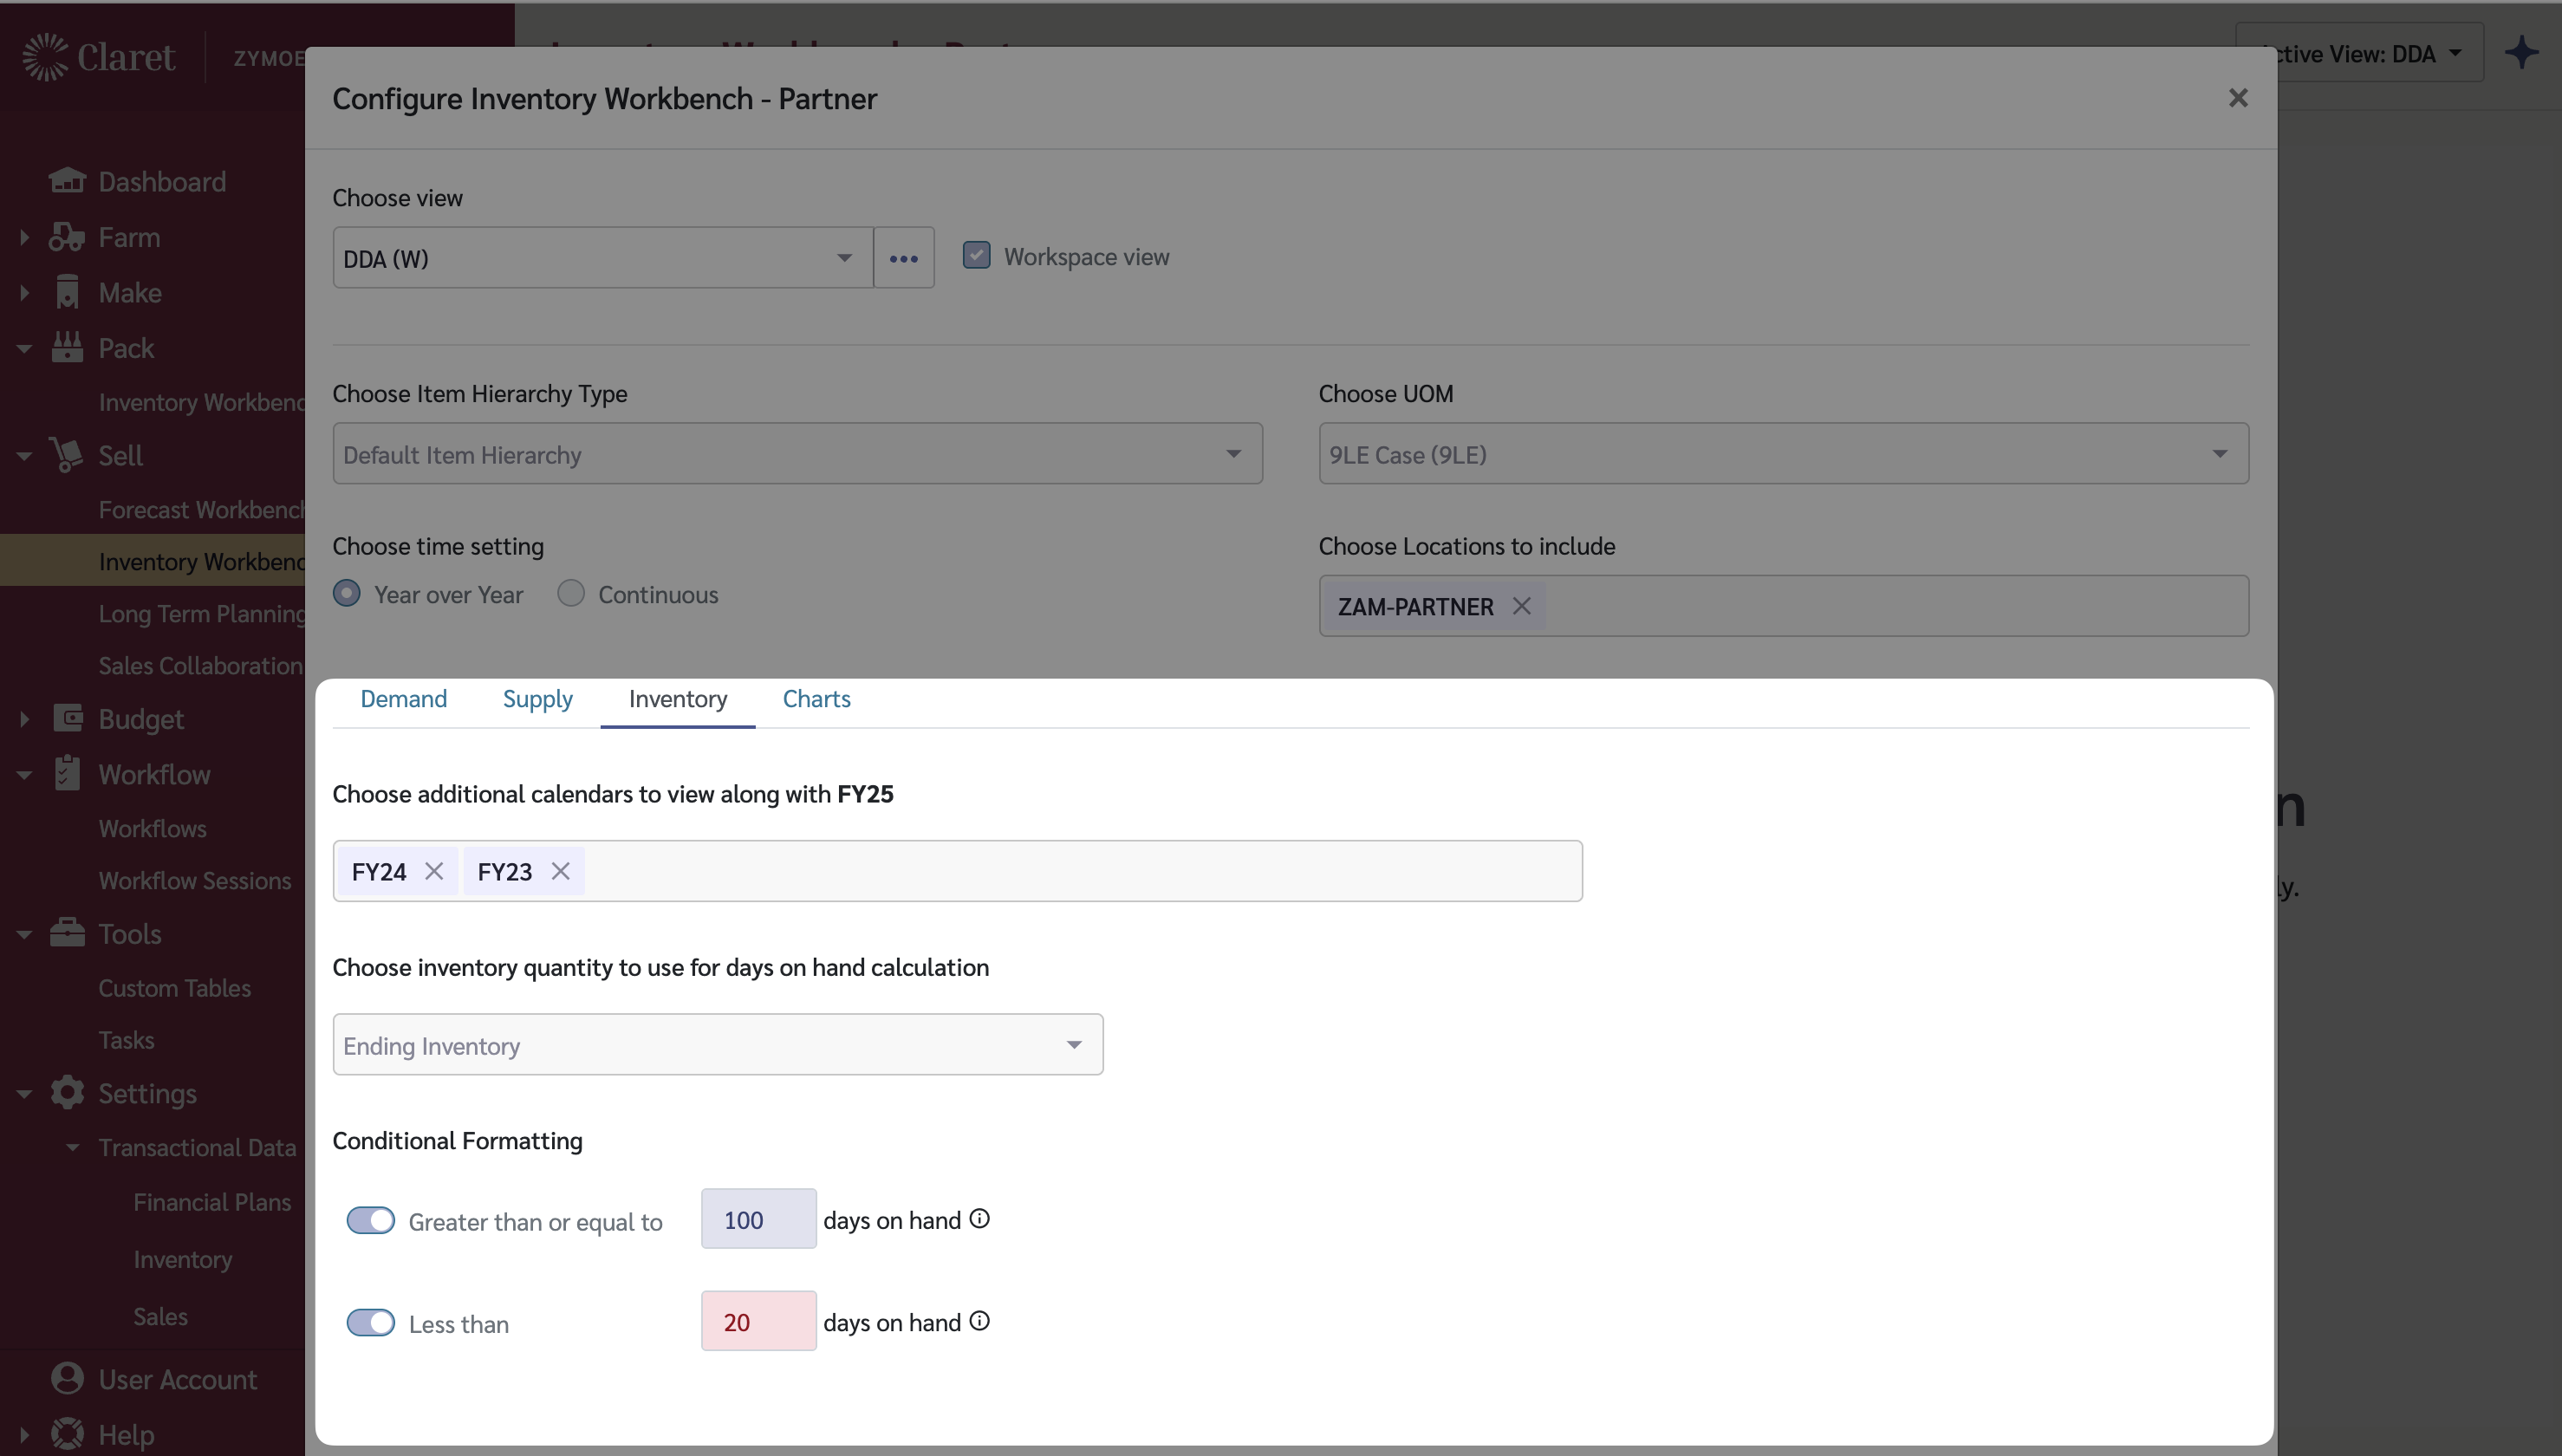
Inventory Workbench - Partner helps you manage partner/distributor inventory levels and shipment forecasts. You can track Days on Hand at partner locations and plan replenishment shipments.

## What's Already Set Up

Claret seeds some data for new tenants. Before starting, check what already exists:

* **Calendars** — Default calendars and calendar definitions have been created.
* **Hierarchy Structures** — Default Finished Goods Item Hierarchy and Customer Group Hierarchy structures exist.

## Prerequisites

* Review [Global Settings](/using-claret/getting-started/global-settings) to confirm calendars and hierarchies are configured
* If you've already set up Sales Collaboration, then Items, Customer Groups, and Item @ Customer Groups are already done

## Setup Steps

Inventory Workbench - Partner requires the following master data to be configured:

| Step | Data                                       | Description                                                                               | Instructions                                                |
| ---- | ------------------------------------------ | ----------------------------------------------------------------------------------------- | ----------------------------------------------------------- |
| 1    | Item Hierarchy & Items                     | The products you ship to partners                                                         | [Items](/master-data/items)                                 |
| 2    | Customer Group Hierarchy & Customer Groups | Your distribution partners                                                                | [Customer Groups](/master-data/customer-groups)             |
| 3    | Item @ Customer Groups                     | Which items are sold to which customers                                                   | [Item @ Customer Groups](/master-data/item-customer-groups) |
| 4    | Partner Locations                          | Where partners hold inventory                                                             | [Location Maintenance](/master-data/location-maintenance)   |
| 5    | Item @ Locations                           | Which items are stocked at each partner location                                          | [Item @ Locations](/master-data/item-locations)             |
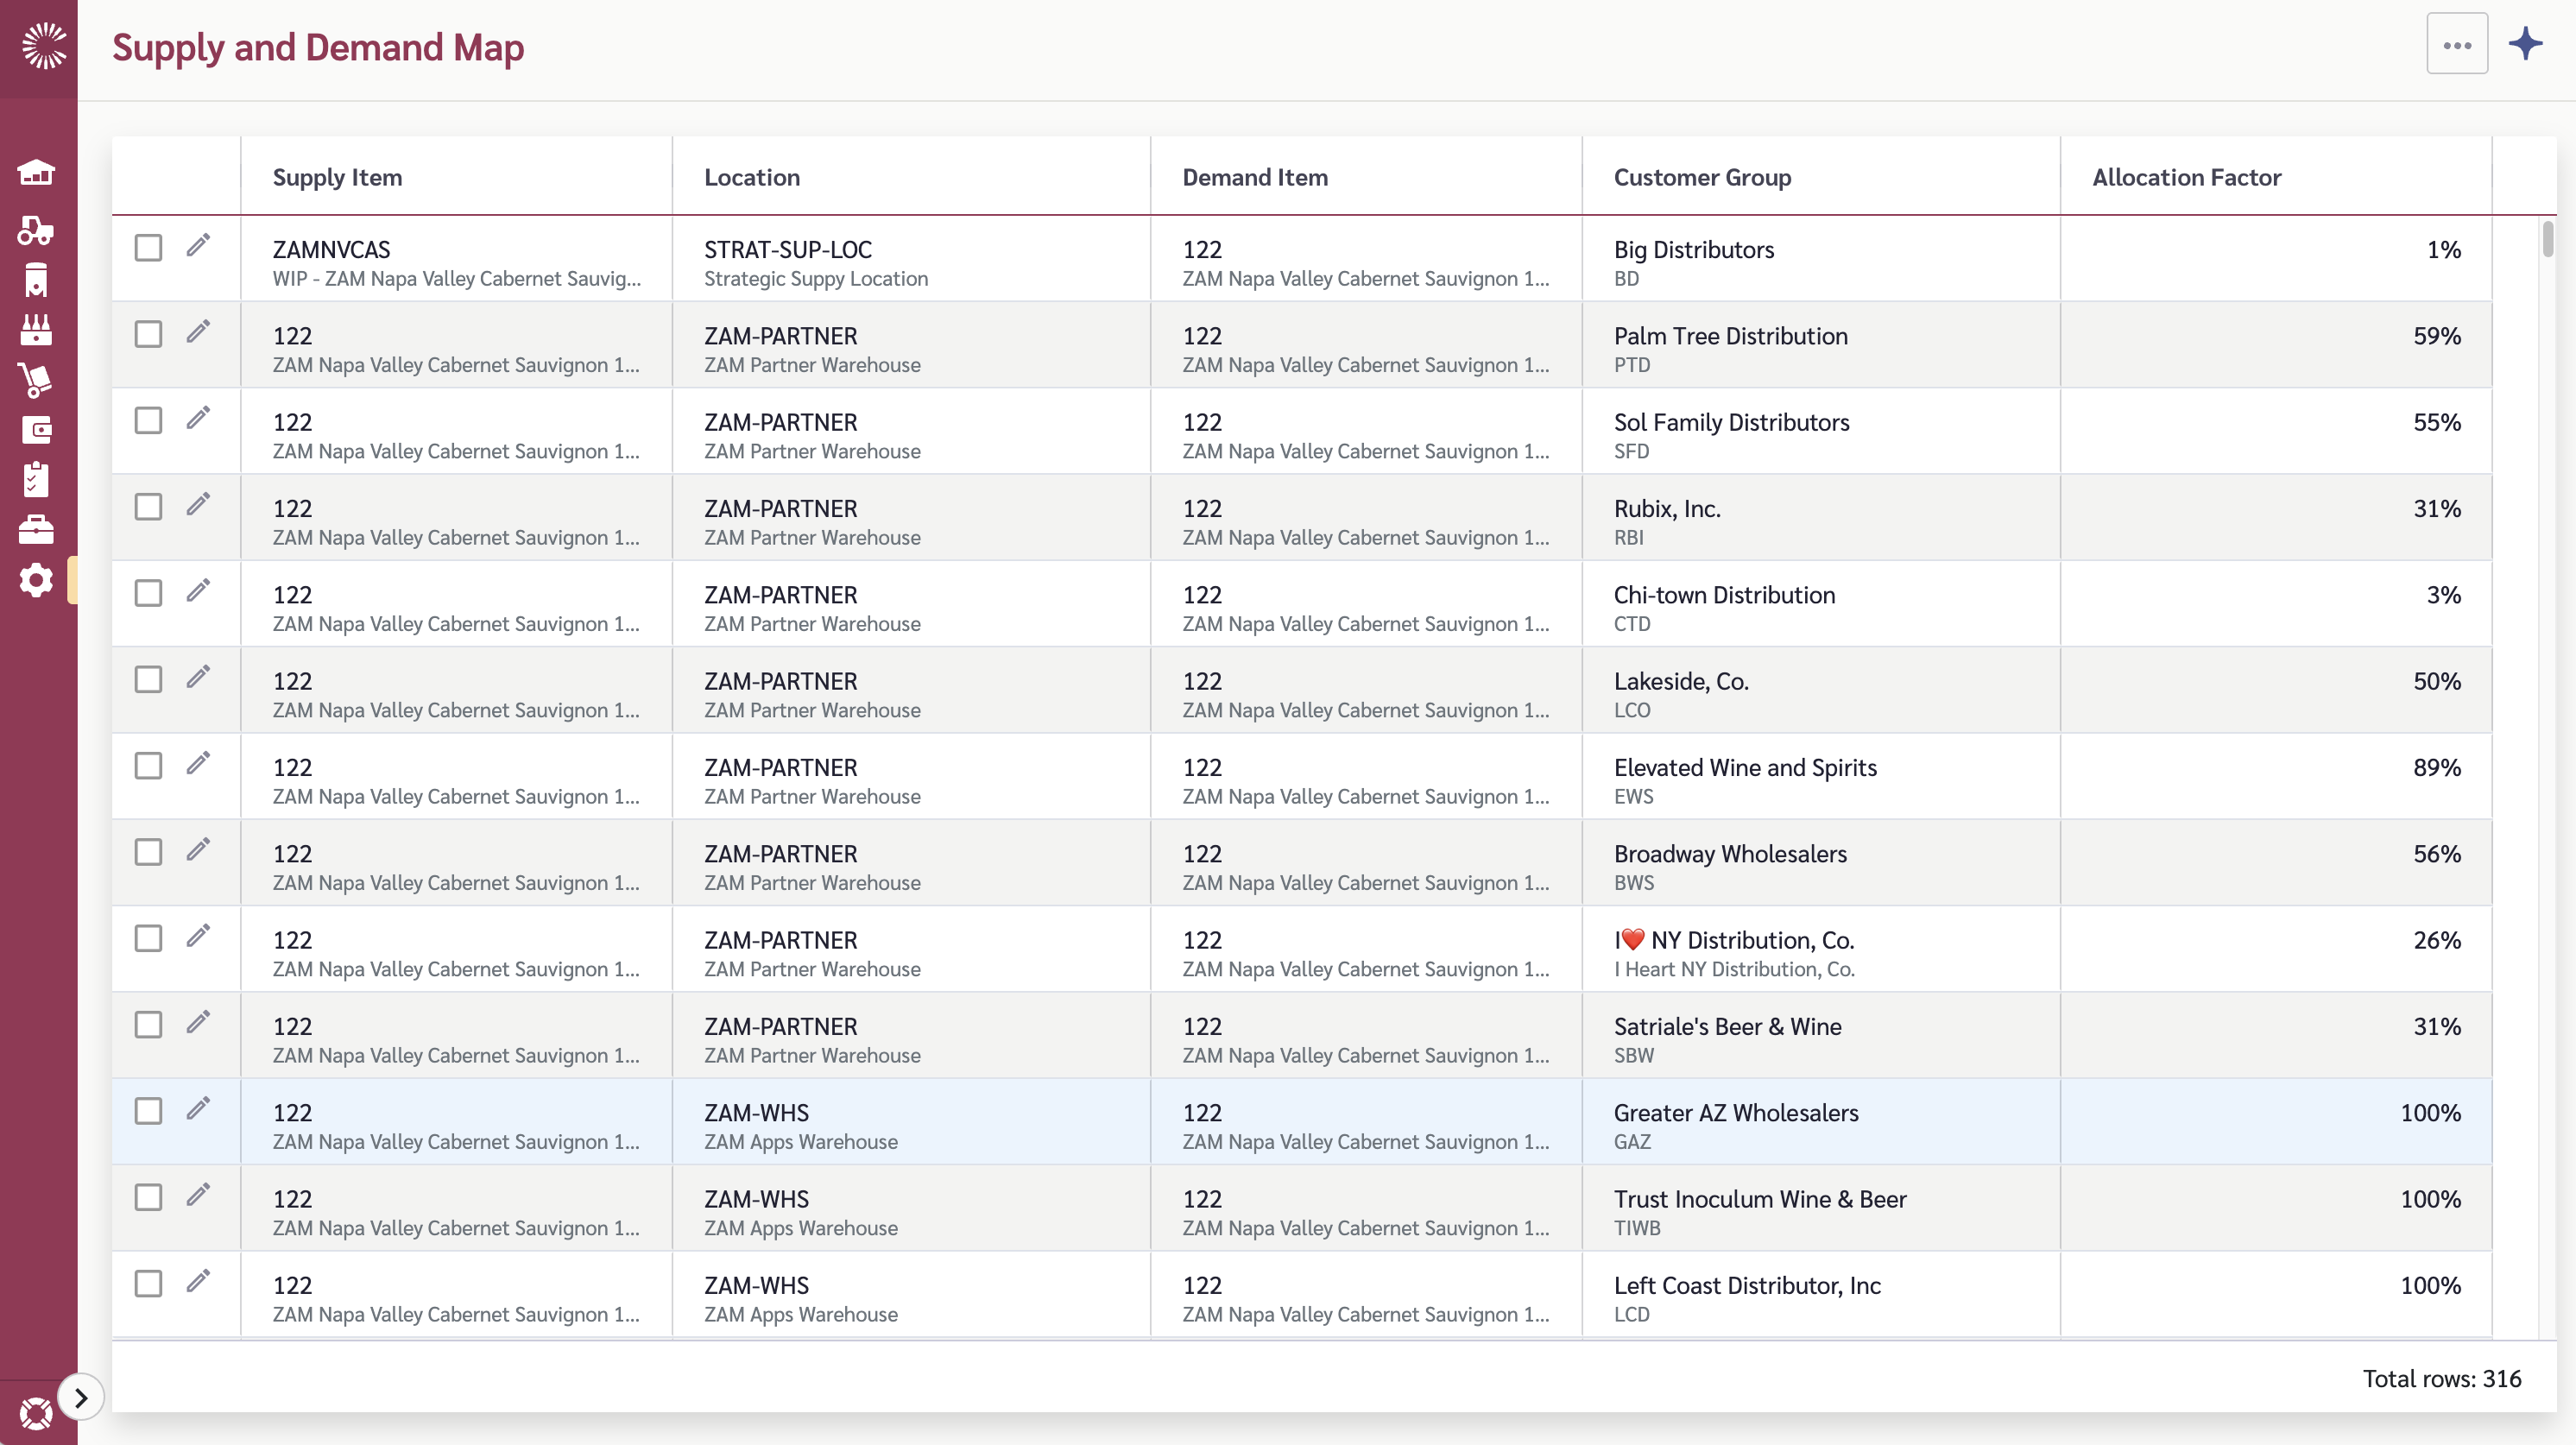
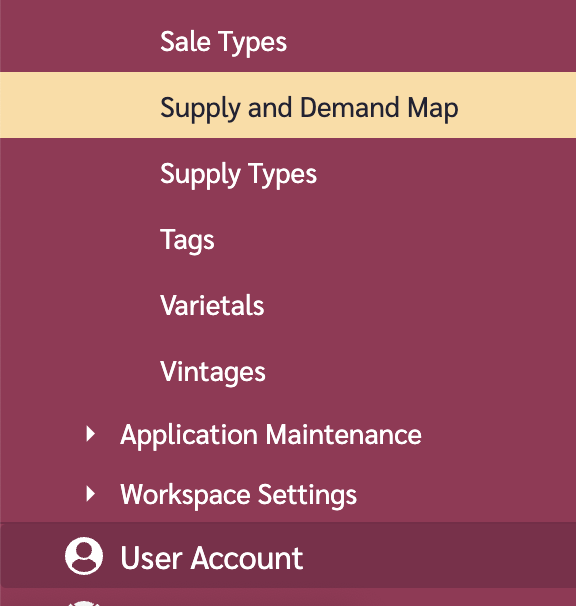
| 6    | Supply and Demand Map                      | Connects Item @ Customer Groups to Item @ Locations ti indicate how supply fulfils demand | [Supply and Demand Map](/master-data/supply-and-demand-map) |
| 7    | Sale Types                                 | For depletion and shipment tracking                                                       | [Sale Types](/master-data/sale-types)                       |

{% hint style="warning" %}
The Supply and Demand Map is required for the workbench to function. Items only appear if they have mappings linking Item @ Customer Groups to Item @ Locations.
{% endhint %}

For detailed step-by-step instructions, see [Inventory Workbench - Partner Setup](/sell/inventory-workbench-partner/inventory-workbench-partner-setup).

## Loading Data

1. **Partner Depletion Data** — Import depletion forecasts/history at Settings > Transactional Data > [Sales](/transactional-data/sales)
2. **Partner Inventory** — Import current inventory levels at Settings > Transactional Data > [Inventory](/transactional-data/inventory)

## What's Next

* [Inventory Workbench - Partner](/sell/inventory-workbench-partner) — detailed usage documentation

## Verification

To verify Inventory Workbench - Partner is set up correctly:

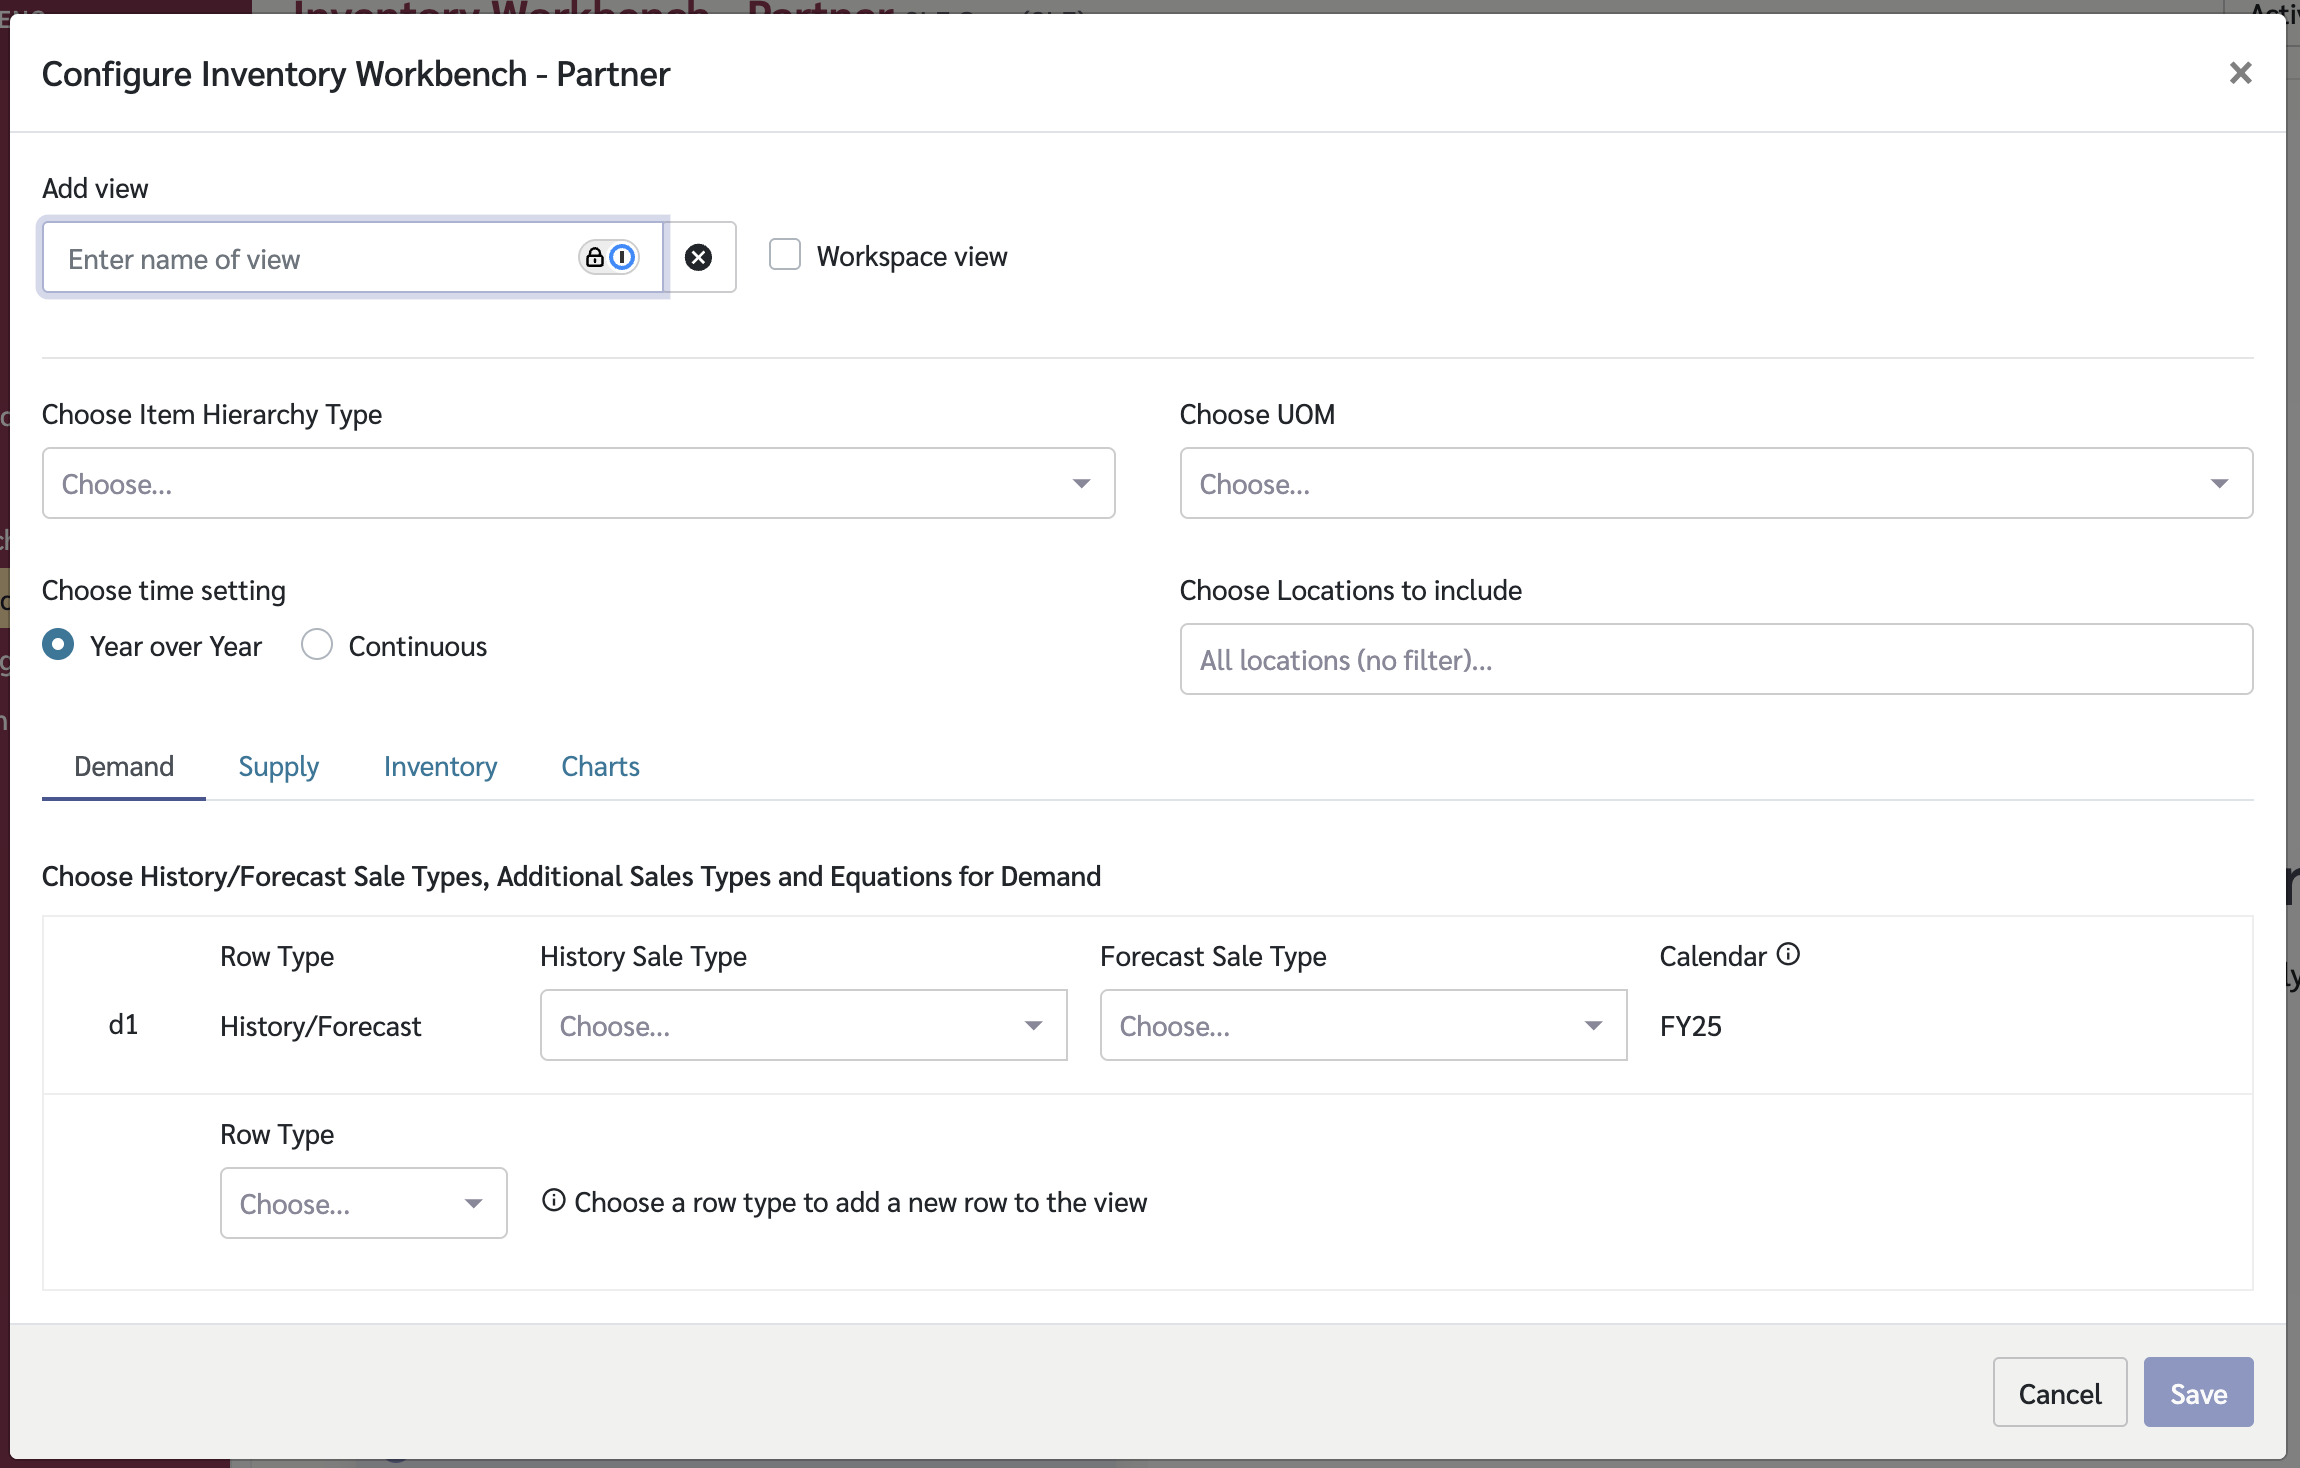
1. Navigate to Sell > Inventory Workbench - Partner
2. Create a new View and select your Item Hierarchy Type and UOM
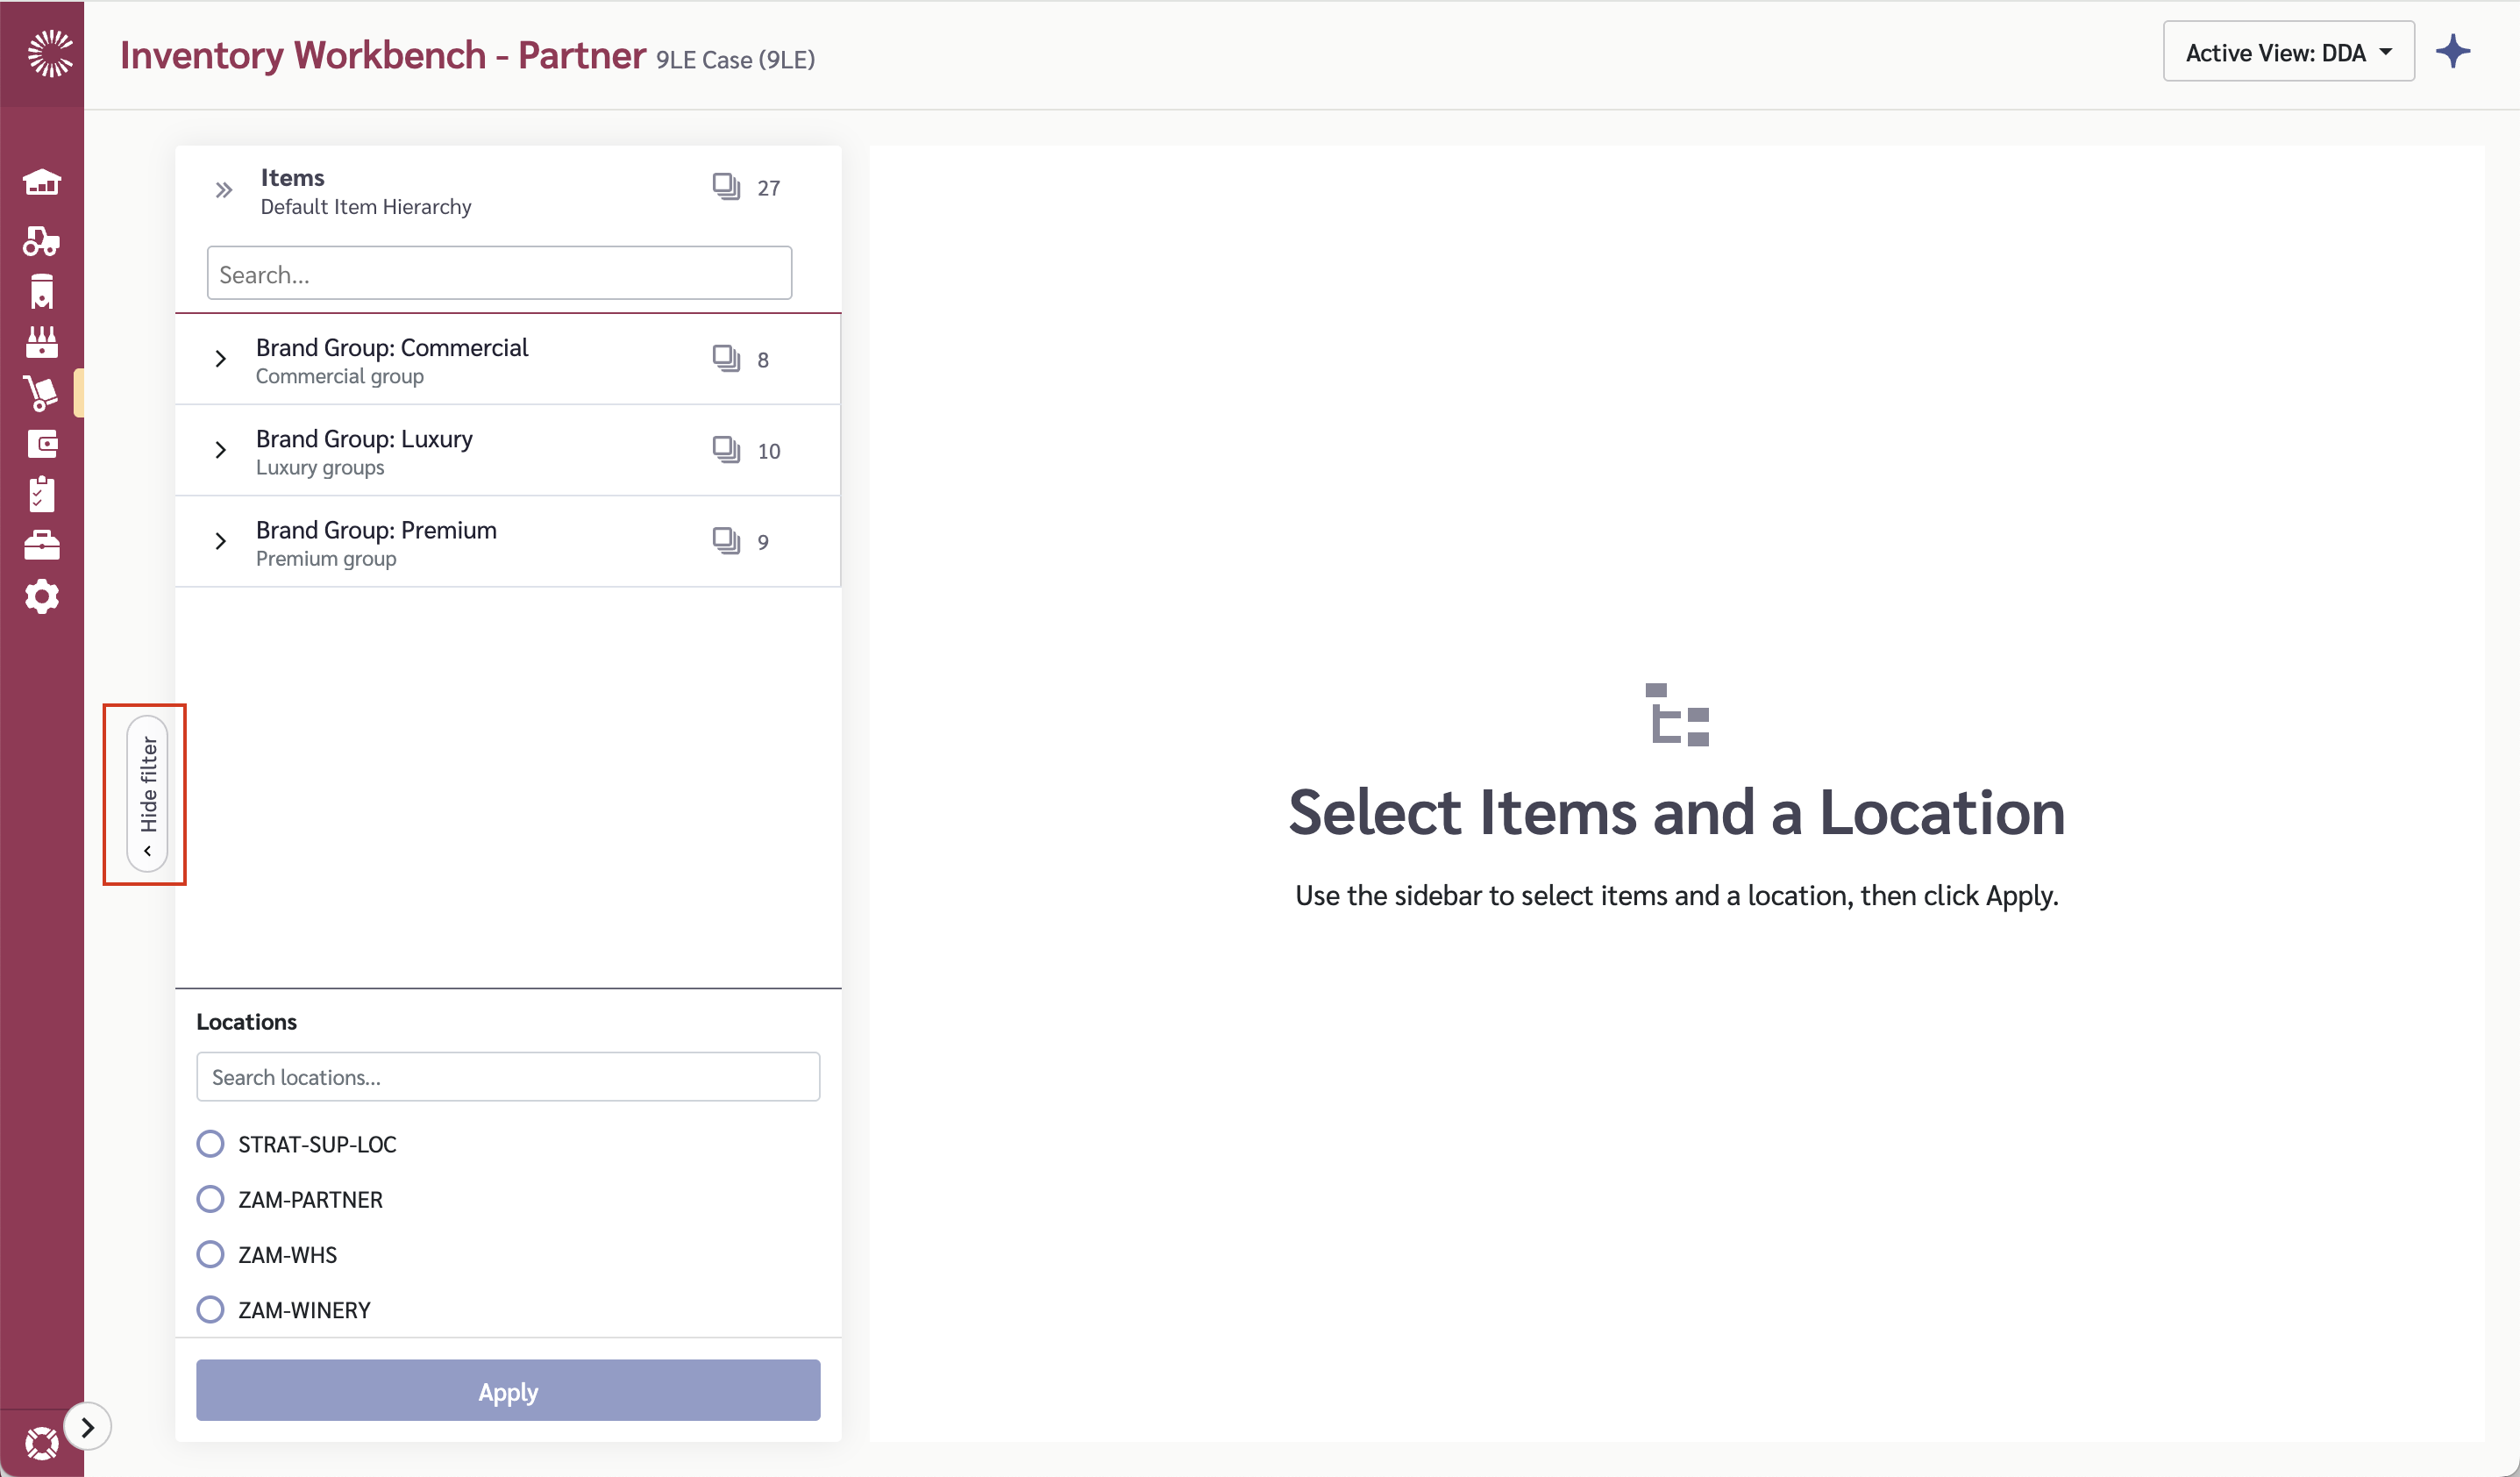
3. Select a partner location from the dropdown
4. You should see items appear in the grid

**If no items appear:**

* Verify Item @ Location links exist at the selected partner location
* Verify Item @ Customer Group links exist
* Verify the Supply and Demand Map connects Item @ Customer Groups to Item @ Locations

## Common Questions

### What's the difference between Internal and Partner workbenches?

Partner tracks inventory at distributor/partner locations (where you ship to). Internal tracks inventory at your own production/storage locations (where you produce and store).

### How is Days on Hand calculated?

DOH = Current Inventory ÷ Average Daily Depletion. The depletion data comes from the Sale Types configured in your view.


# Setting Up Inventory Workbench - Internal

Step-by-step setup guide for Inventory Workbench - Internal in Claret. Covers prerequisites, required master data, and verification steps for admin users.

Inventory Workbench - Internal helps you manage production planning at your own locations. It calculates Days on Hand, generates supply plan recommendations, and allows you to plan production based on demand forecasts.

## What's Already Set Up

Claret seeds some data for new tenants. Before starting, check what already exists:

* **Calendars** — Default calendars and calendar definitions have been created.
* **Hierarchy Structures** — Default Finished Goods Item Hierarchy and Customer Group Hierarchy structures exist.

## Prerequisites

* Review [Global Settings](/using-claret/getting-started/global-settings) to confirm calendars and hierarchies are configured
* If you've set up Sales Collaboration, then Items, Customer Groups, and Item @ Customer Groups are already done

## Setup Steps

Inventory Workbench - Internal requires the following master data to be configured:

| Step | Data                                       | Description                                                                                   | Instructions                                                |
| ---- | ------------------------------------------ | --------------------------------------------------------------------------------------------- | ----------------------------------------------------------- |
| 1    | Item Hierarchy & Items                     | The products you produce and store                                                            | [Items](/master-data/items)                                 |
| 2    | Locations                                  | Your production and storage locations                                                         | [Location Maintenance](/master-data/location-maintenance)   |
| 3    | Item @ Locations                           | Which items are stored at each location                                                       | [Item @ Locations](/master-data/item-locations)             |
| 4    | Customer Group Hierarchy & Customer Groups | Who buys your products (drives demand)                                                        | [Customer Groups](/master-data/customer-groups)             |
| 5    | Item @ Customer Groups                     | Which items are sold to which customers                                                       | [Item @ Customer Groups](/master-data/item-customer-groups) |
| 6    | Supply and Demand Map                      | Connects Item @ Customer Groups to Item @ Locations to define how to allocate suppy to demand | [Supply and Demand Map](/master-data/supply-and-demand-map) |
| 7    | Sale Types                                 | For demand forecasts                                                                          | [Sale Types](/master-data/sale-types)                       |
| 8    | Supply Types                               | For production plans                                                                          | [Supply Types](/master-data/supply-types)                   |

{% hint style="warning" %}
The Supply and Demand Map is required for the workbench to function. Items only appear if they have mappings linking Item @ Customer Groups to Item @ Locations.
{% endhint %}

For detailed step-by-step instructions, see [Inventory Workbench - Internal Setup](/pack/inventory-workbench-internal/inventory-workbench-internal-setup).

## Loading Data

1. **Sales Forecasts** — Import demand data at Settings > Transactional Data > [Sales](/transactional-data/sales)
2. **Inventory** — Import current inventory levels at Settings > Transactional Data > [Inventory](/transactional-data/inventory)
3. **Supply Plans (Optional)** — Import existing production plans at Settings > Transactional Data > [Supply Plans](/transactional-data/supply-plans)

## What's Next

* [Inventory Workbench - Internal](/pack/inventory-workbench-internal) — detailed usage documentation

## Verification

To verify Inventory Workbench - Internal is set up correctly:

1. Navigate to Pack > Inventory Workbench - Internal
2. Create a new View and select your Item Hierarchy Type and UOM
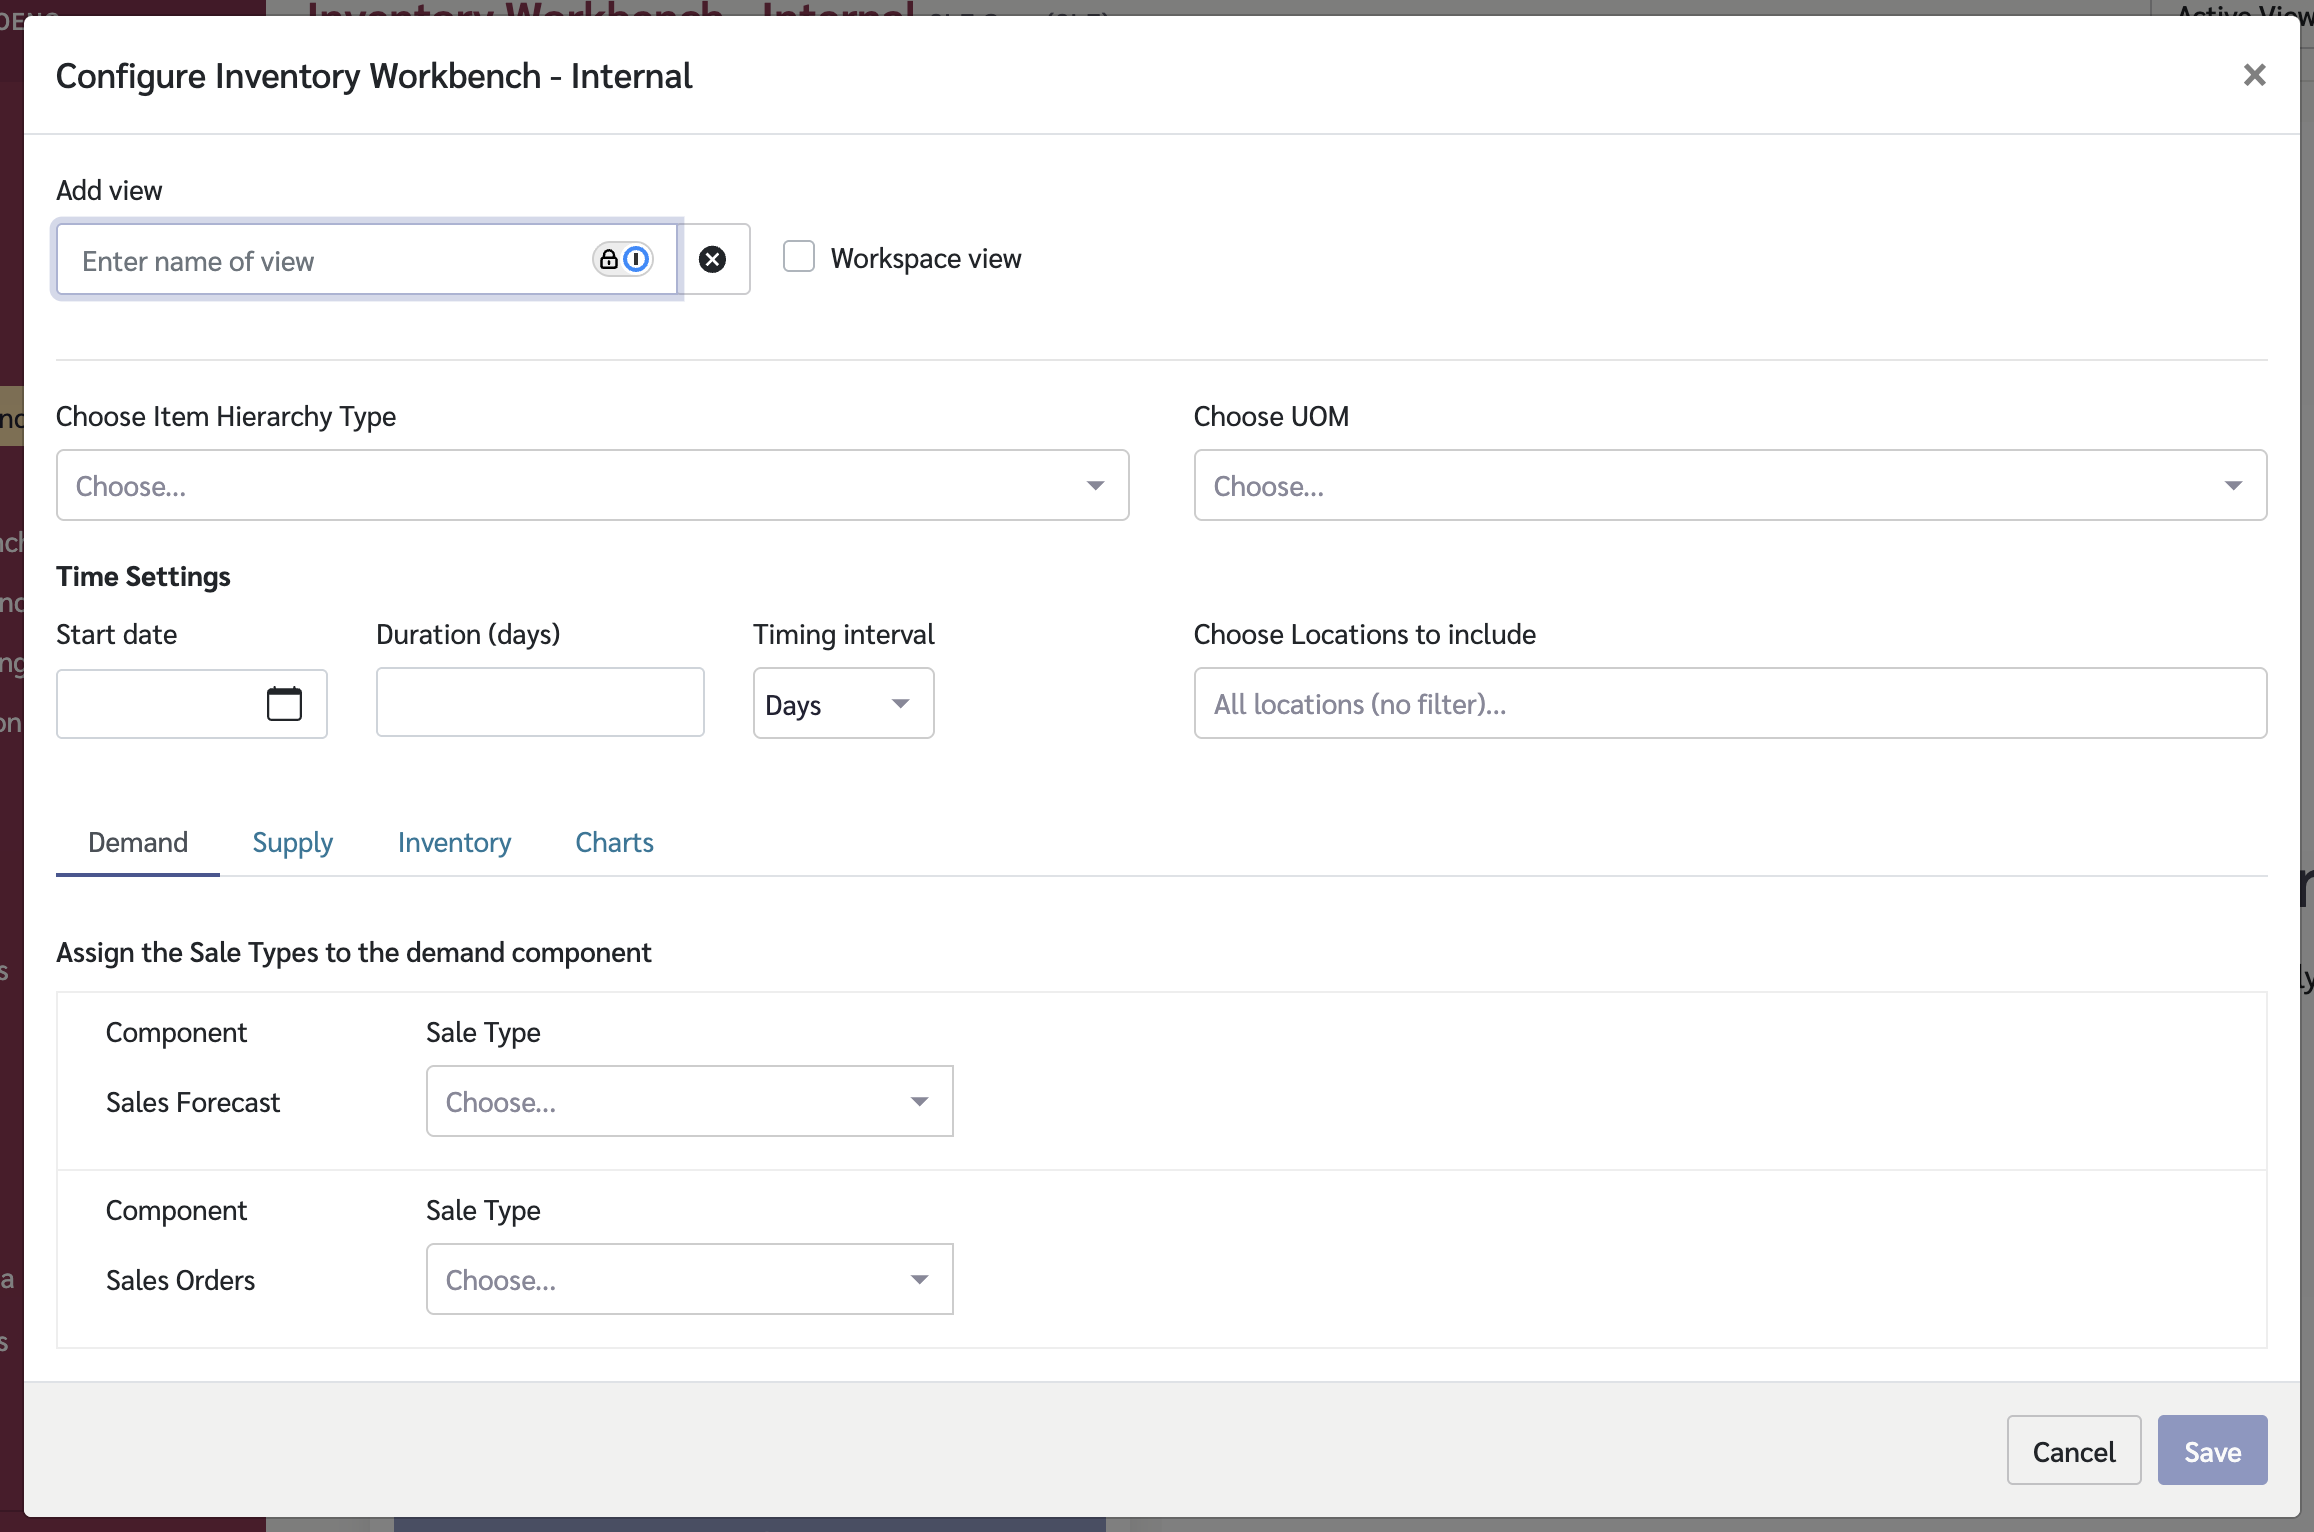
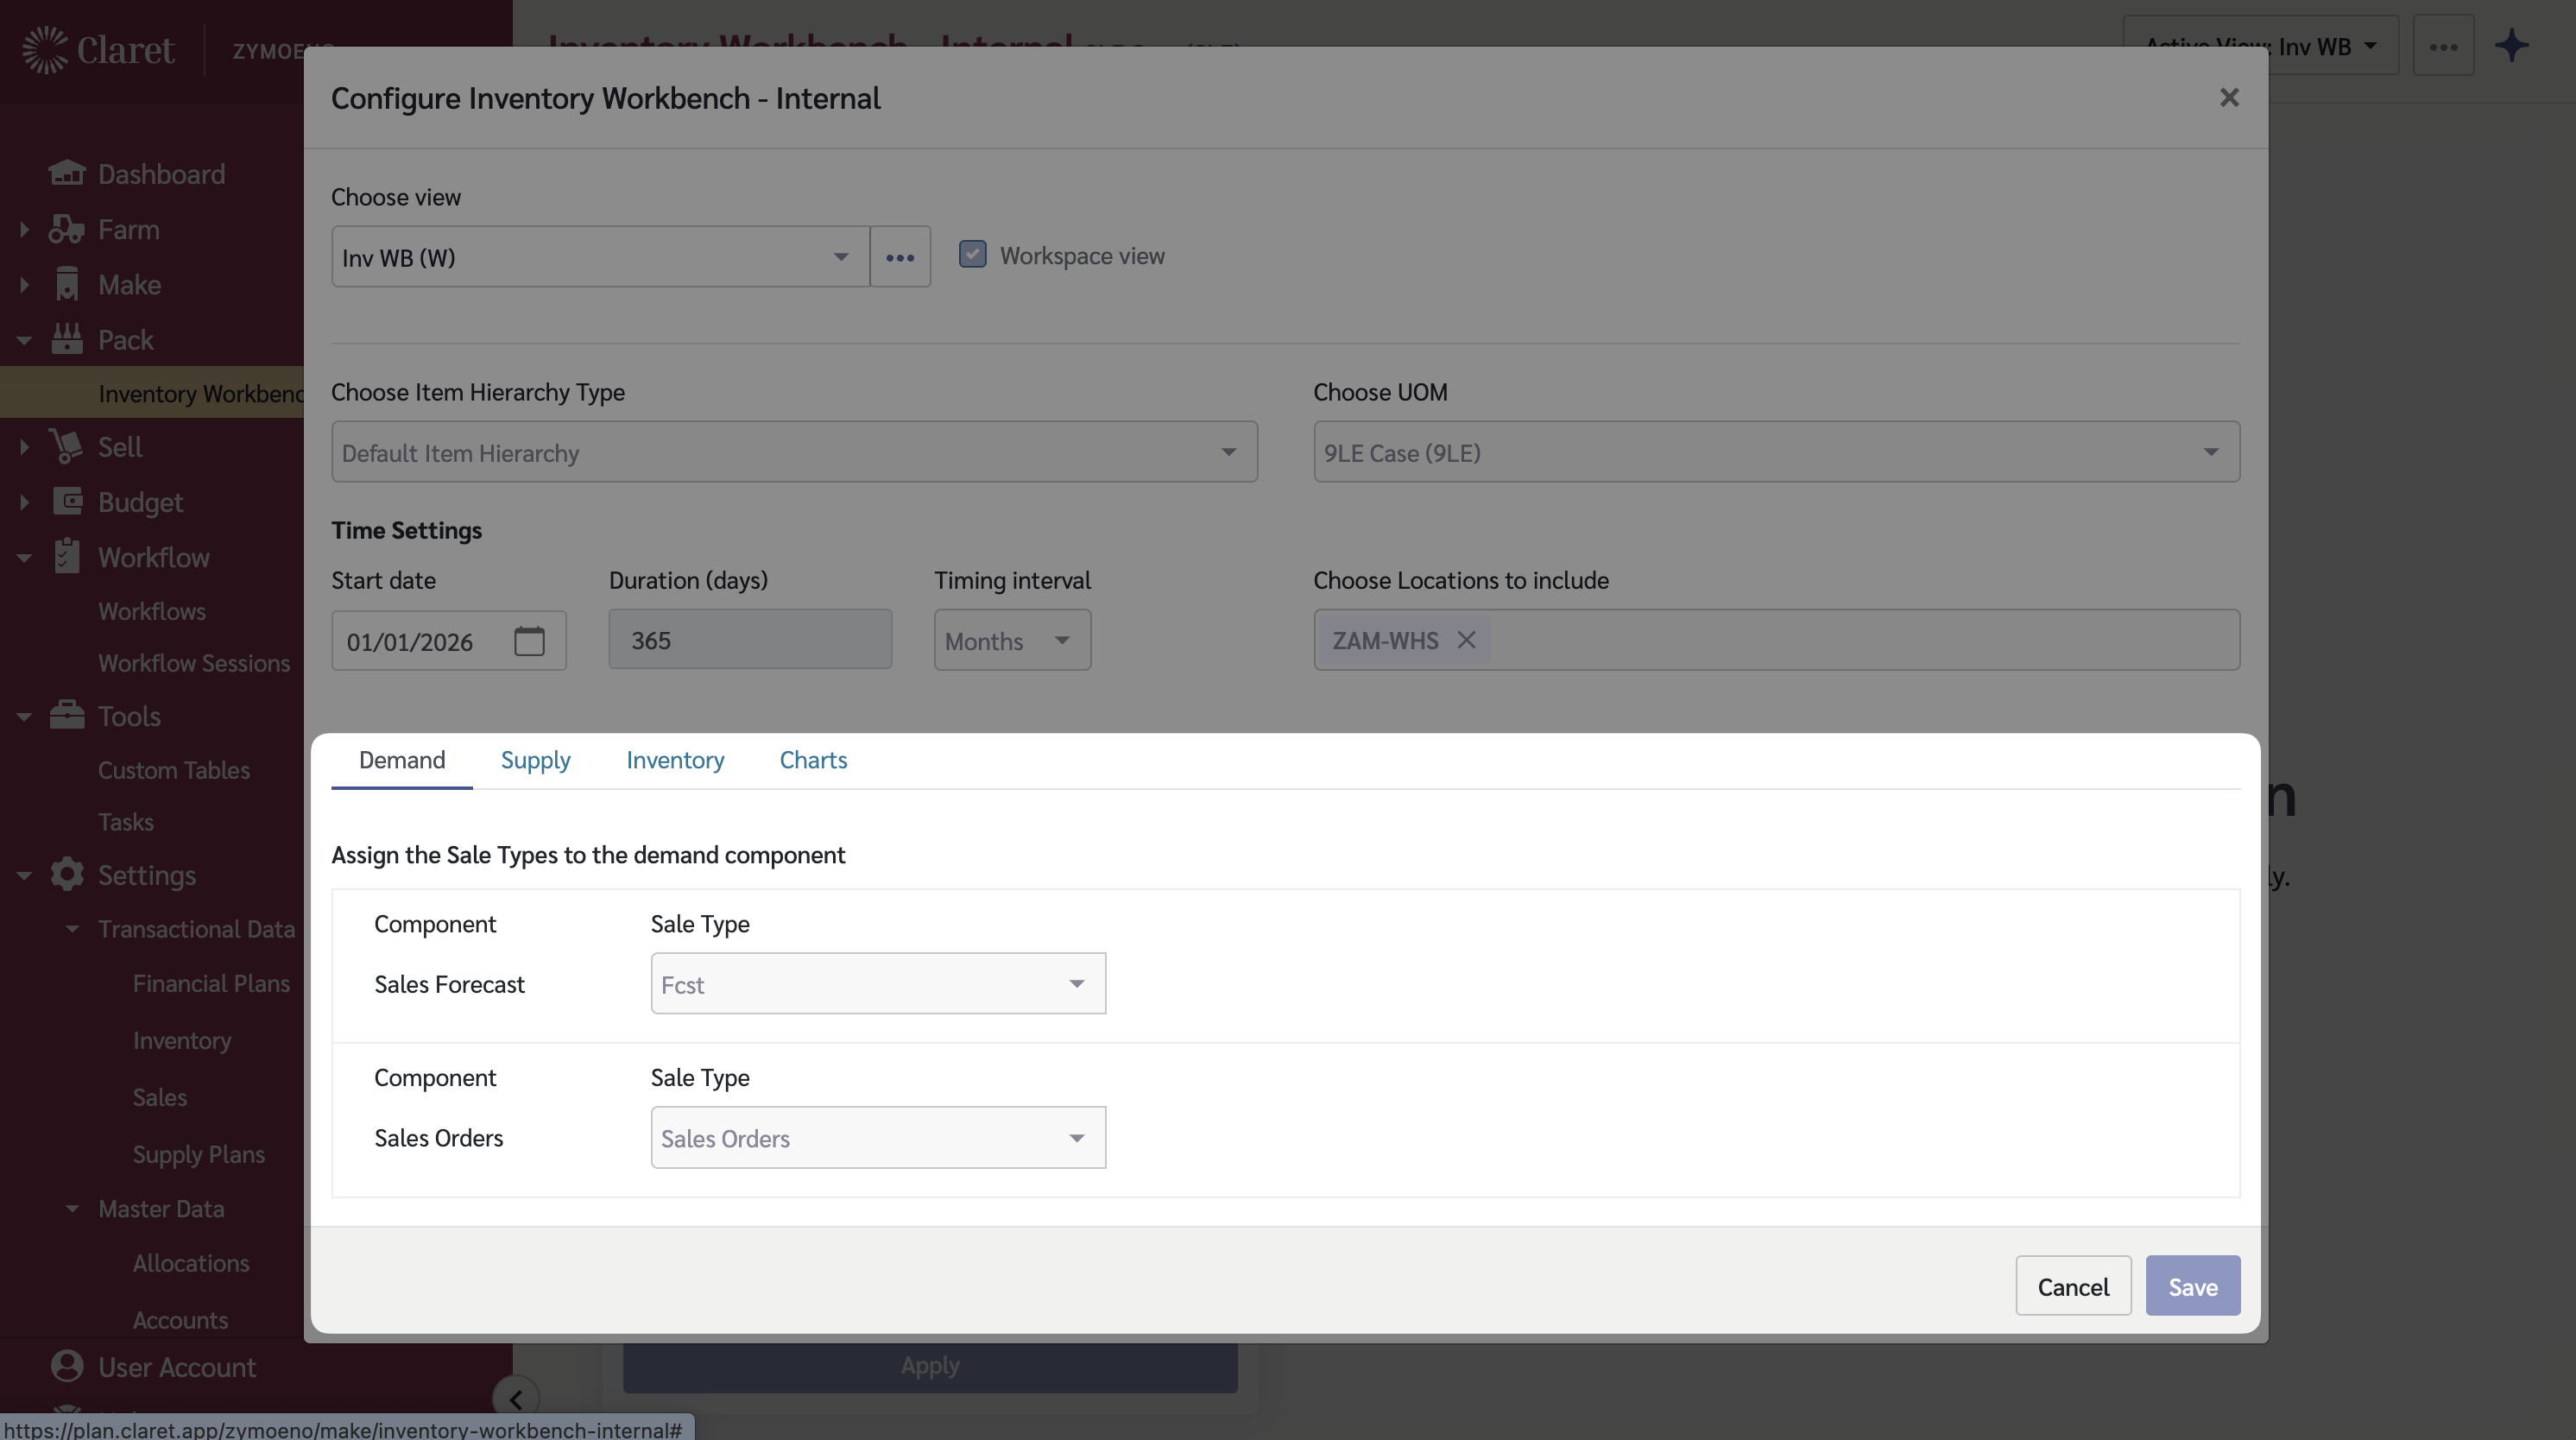
3. Configure the Demand tab with your sales forecast Sale Type
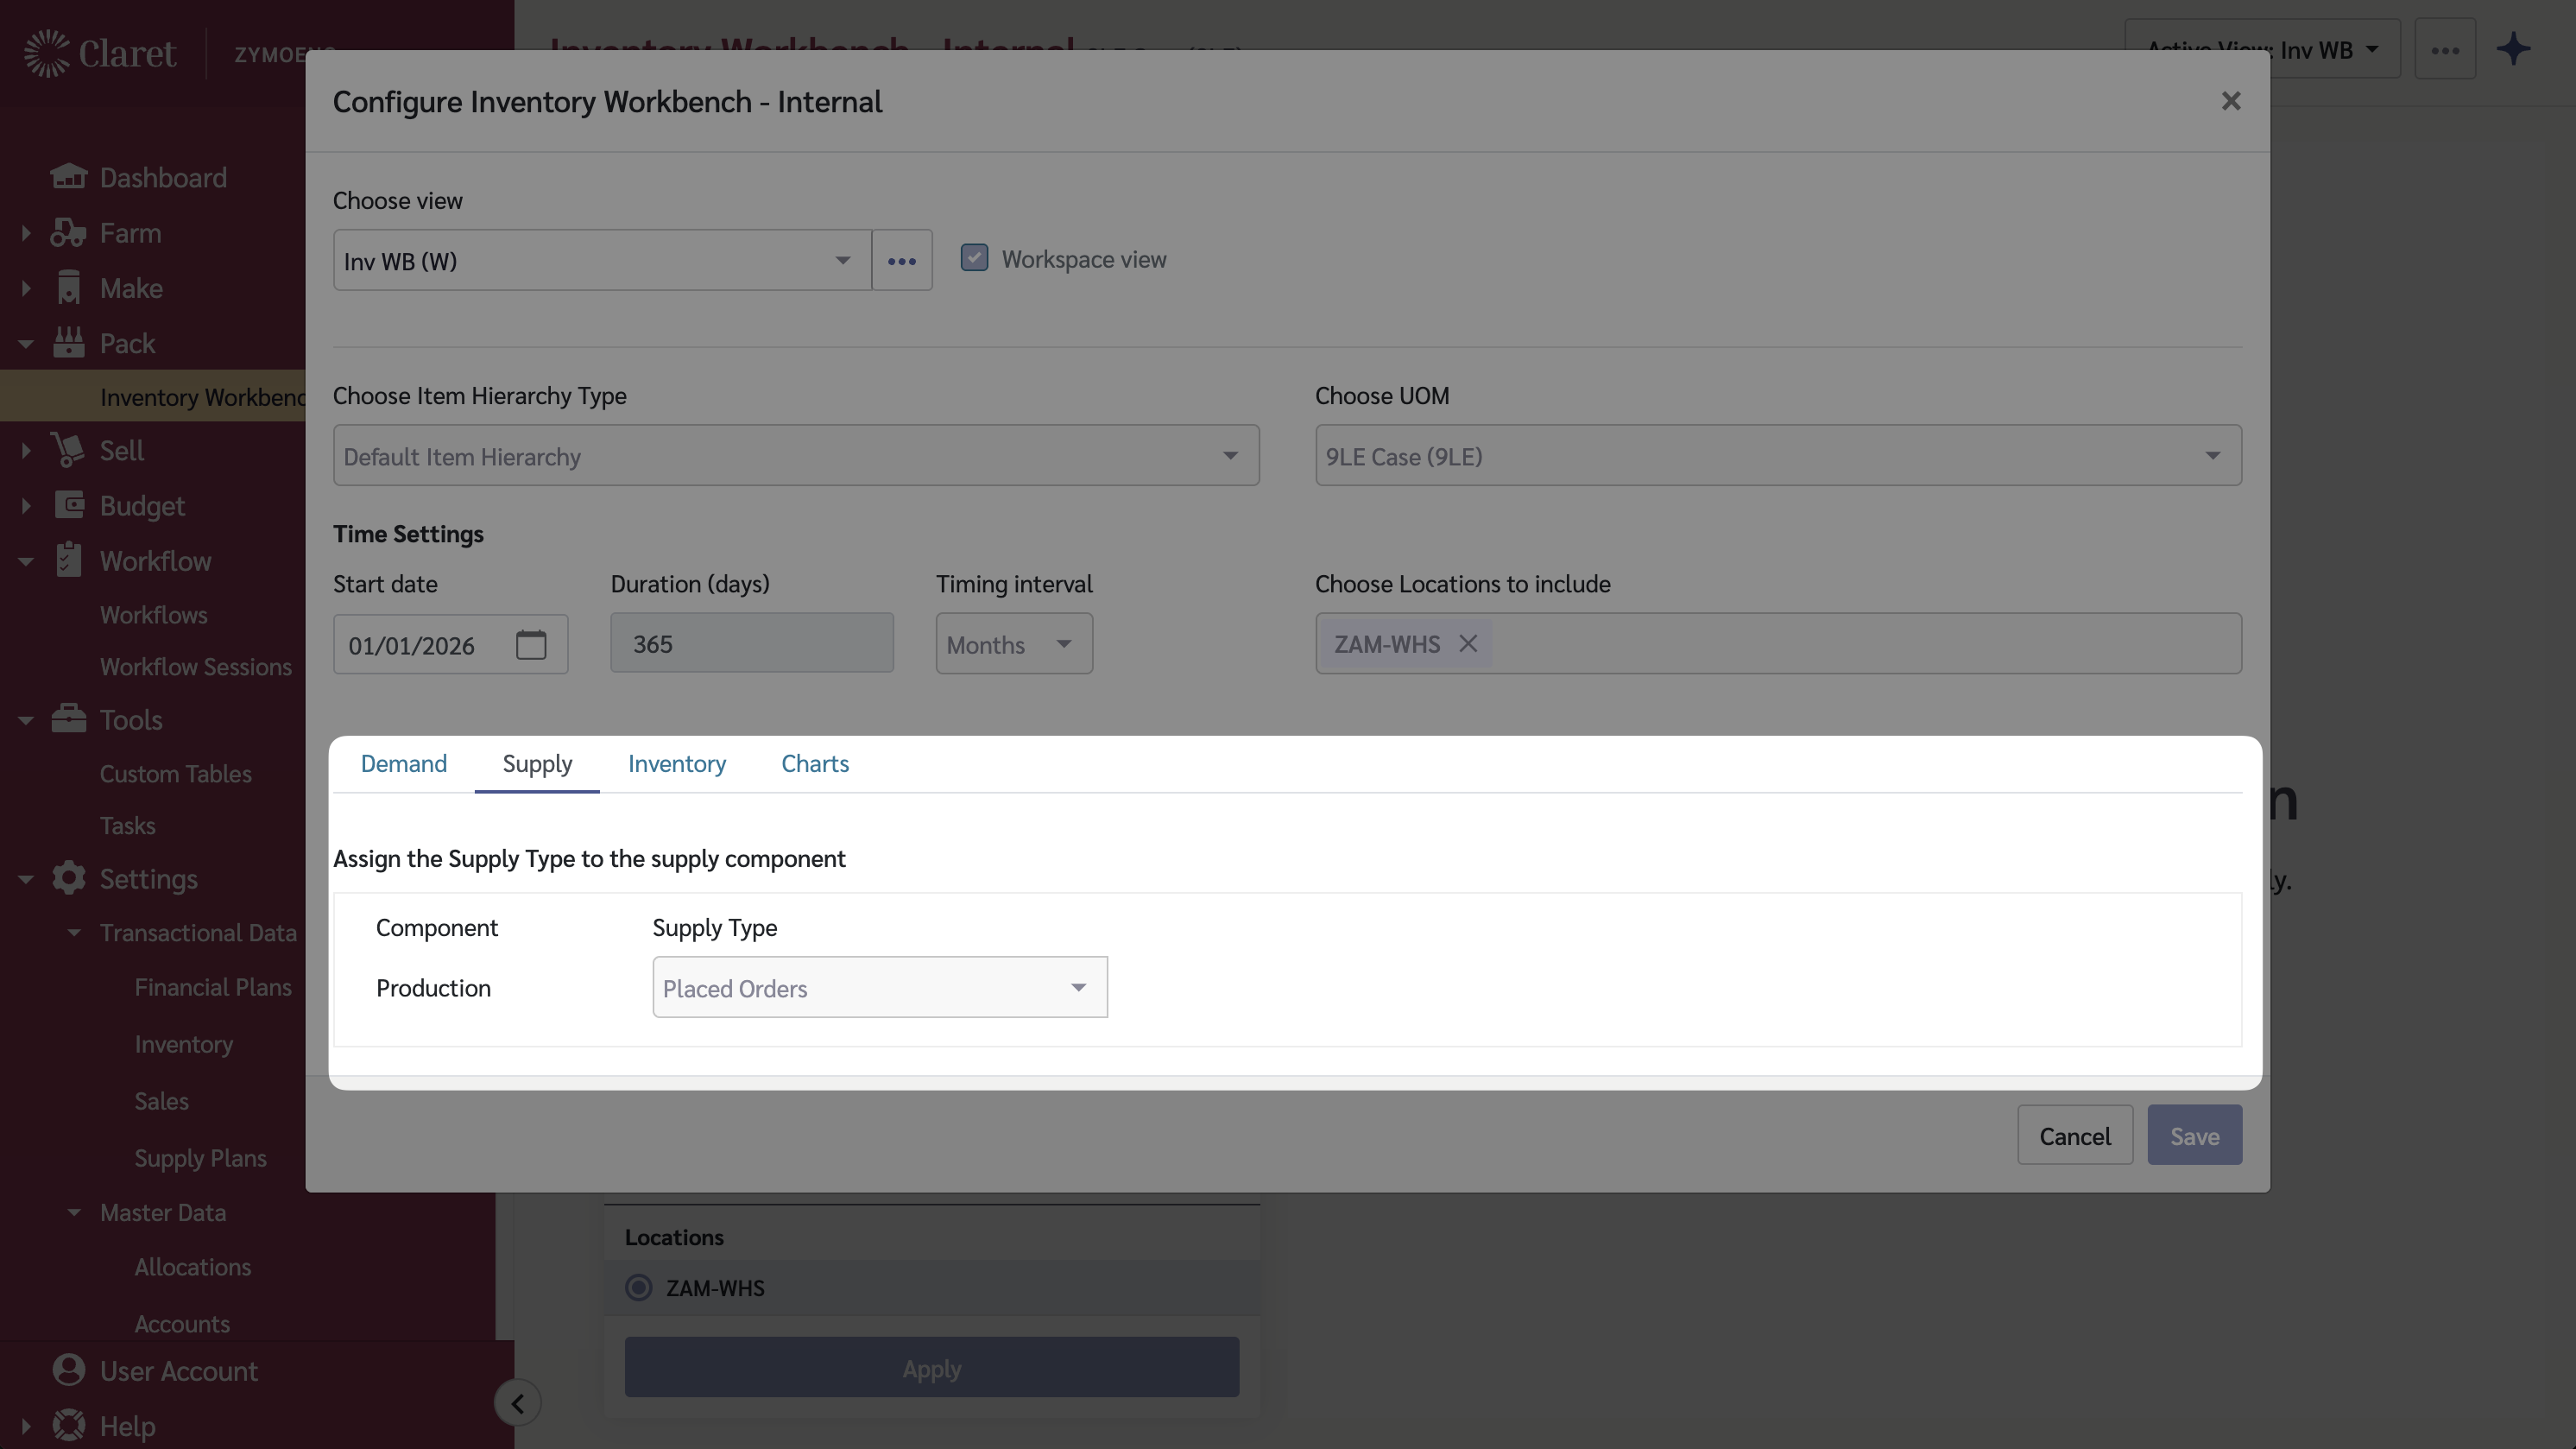
4. Configure the Supply tab with your Supply Type
5. Select a location from the dropdown
6. You should see items appear in the grid

**If no items appear:**

* Verify Item @ Location links exist at the selected location
* Verify Item @ Customer Group links exist
* Verify the Supply and Demand Map connects Item @ Customer Groups to Item @ Locations

## Common Questions

### How does supply plan generation work?

The workbench calculates when production is needed based on demand forecasts, current inventory, and your DOH targets. You can run supply plan generation to automatically create production recommendations.

### What's the difference between Internal and Partner workbenches?

Internal tracks inventory at your own locations (where you produce and store). Partner tracks inventory at distributor/partner locations (where you ship to).


# Setting Up Make Planning

Step-by-step setup guide for Make Planning in Claret. Covers prerequisites, required master data, and verification steps for admin users.

Make Planning connects finished goods demand to work-in-process (WIP) production. It allows you to plan bulk wine production by vintage, and see the impact on vintage change of inventory and demand forecasts.

## What's Already Set Up

Claret seeds some data for new tenants. Before starting, check what already exists:

* **Calendars** — Default calendars have been created.
* **Varietals** — Some default varietals may exist. Review at Master Data > Varietals.
* **Vintages** — A set of vintages have been set up. Review at Master Data > Vintages.
* **Hierarchy Structures** — Default structures for Finished Goods and Work in Process hierarchies exist.

## Prerequisites

* Review [Global Settings](/using-claret/getting-started/global-settings) to confirm calendars, varietals, and vintages are configured
* If you've set up any features in the Sell module, Finished Goods Items, Customer Groups, and Item @ Customer Groups are already done

## Setup Steps

Make Planning requires the following master data to be configured:

| Step | Data                 | Description                                | Instructions                                                           |
| ---- | -------------------- | ------------------------------------------ | ---------------------------------------------------------------------- |
| 1    | Item Hierarchy (FG)  | Finished goods hierarchy                   | [Item Hierarchy](/master-data/item-hierarchy)                          |
| 2    | Items (FG)           | Finished goods you sell                    | [Items](/master-data/items)                                            |
| 3    | Item Hierarchy (WIP) | Work in process hierarchy (Parent/Child)   | [Item Hierarchy](/master-data/item-hierarchy)                          |
| 4    | Items (WIP)          | Bulk wine items with vintages and routings | [Work in Process Items](/master-data/items/work-in-process-aged-items) |
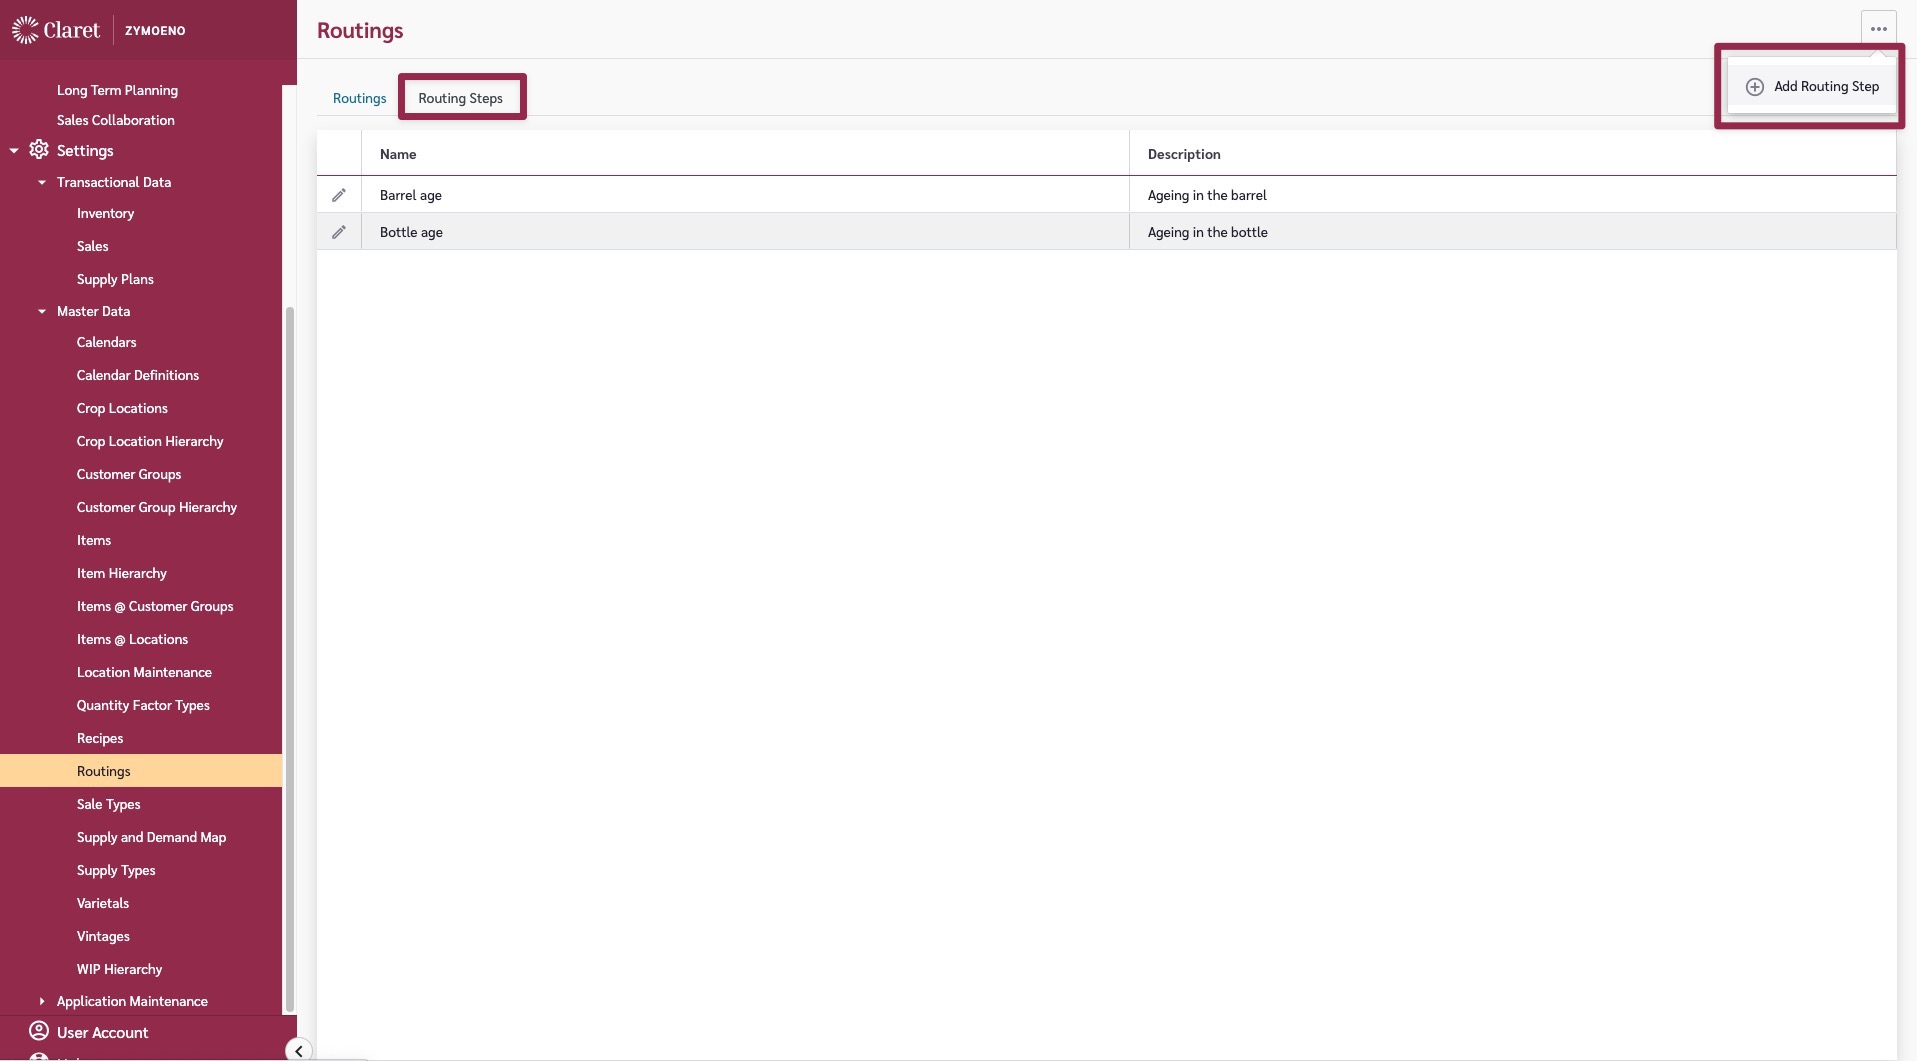
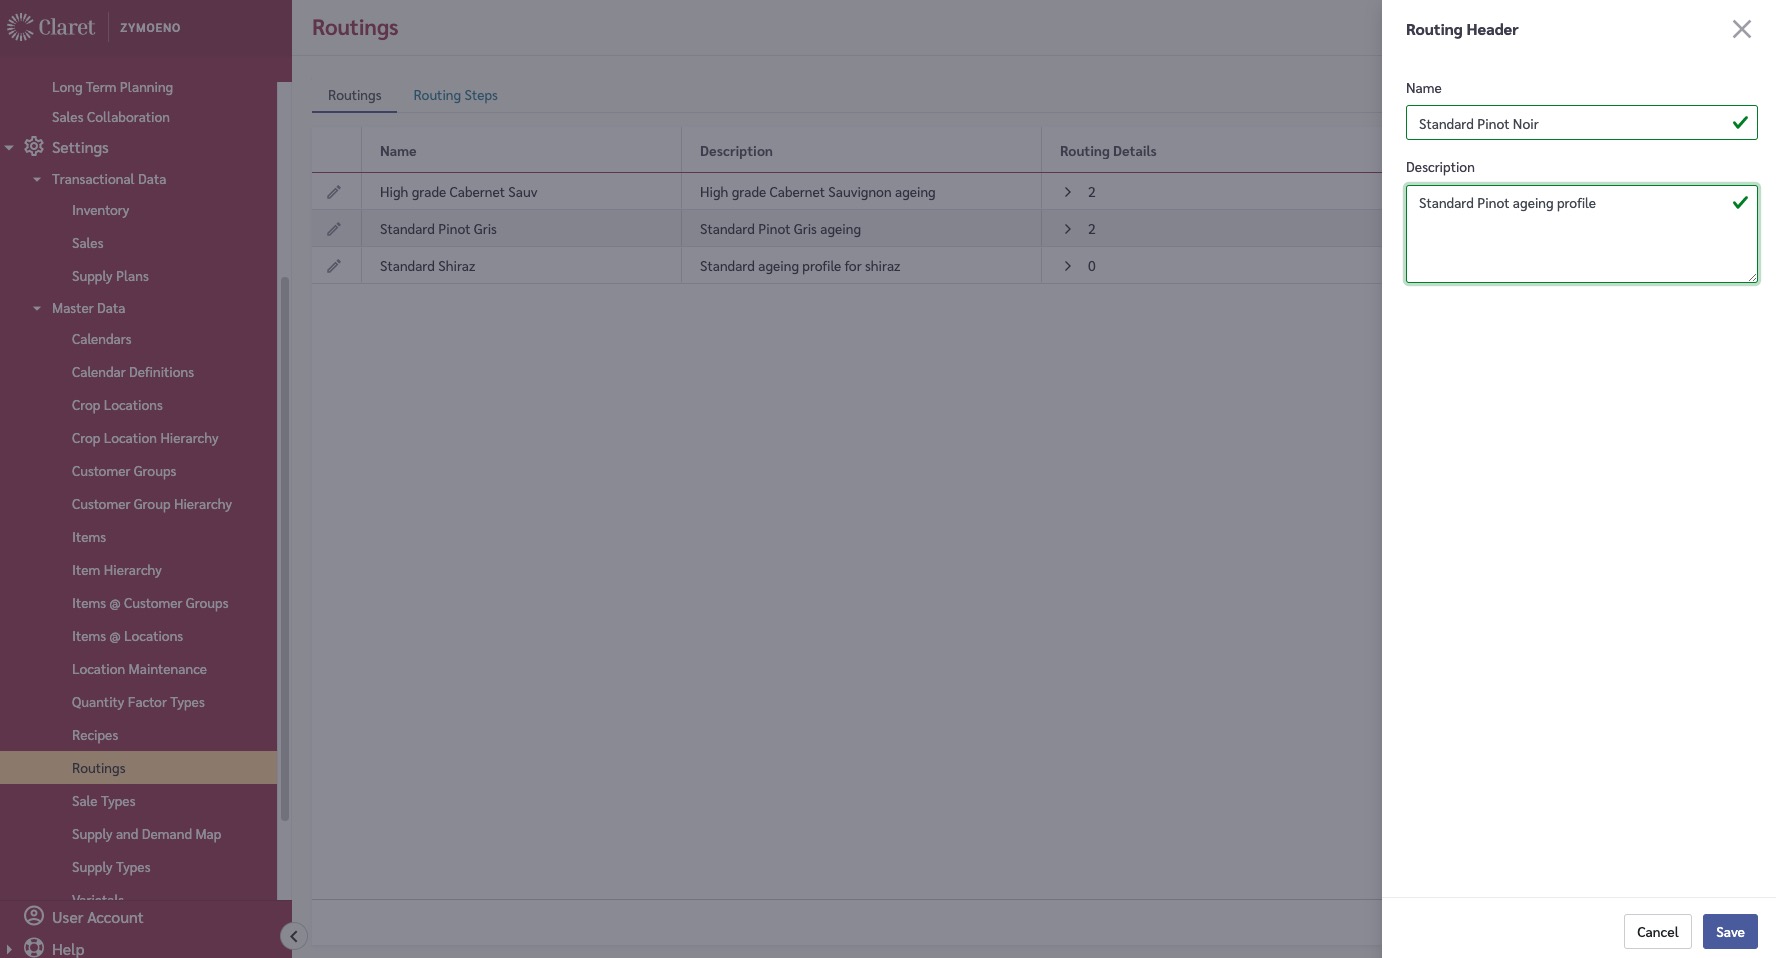
| 5    | Routings             | Aging processes and timeframes             | [Routings](/master-data/routings)                                      |
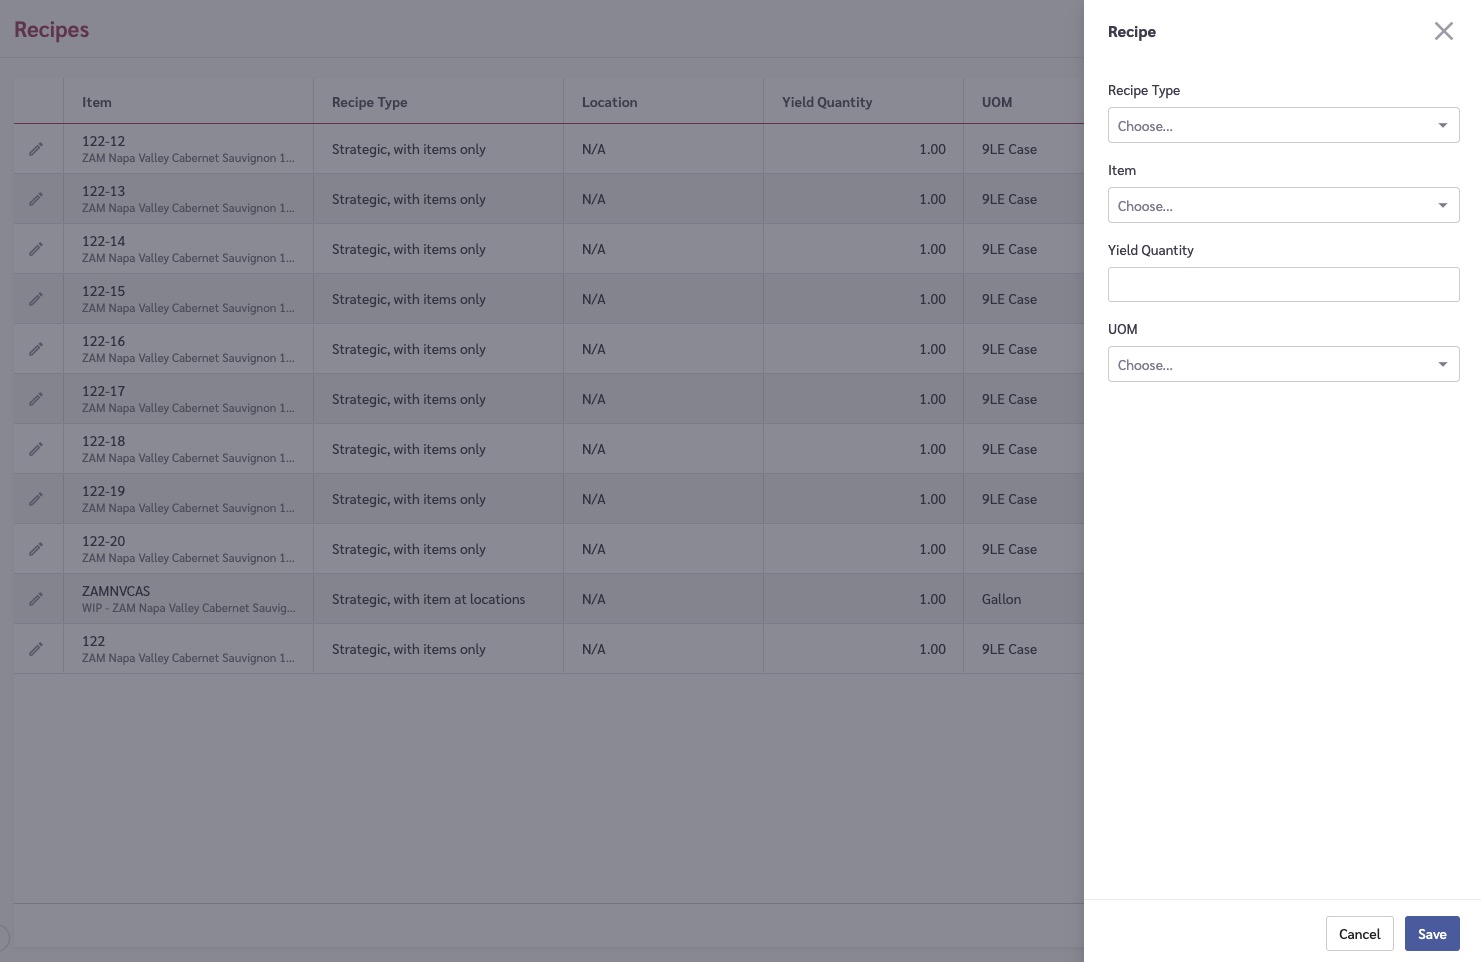
| 6    | Recipes              | Connect WIP items to finished goods        | [Recipes](/master-data/recipes)                                        |
| 7    | Locations            | Where you make and store wine              | [Location Maintenance](/master-data/location-maintenance)              |
| 8    | Item @ Locations     | Which items are at which locations         | [Item @ Locations](/master-data/item-locations)                        |
| 9    | Supply Types         | For supply/production plans                | [Supply Types](/master-data/supply-types)                              |

{% hint style="info" %}
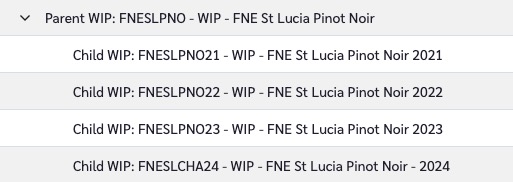
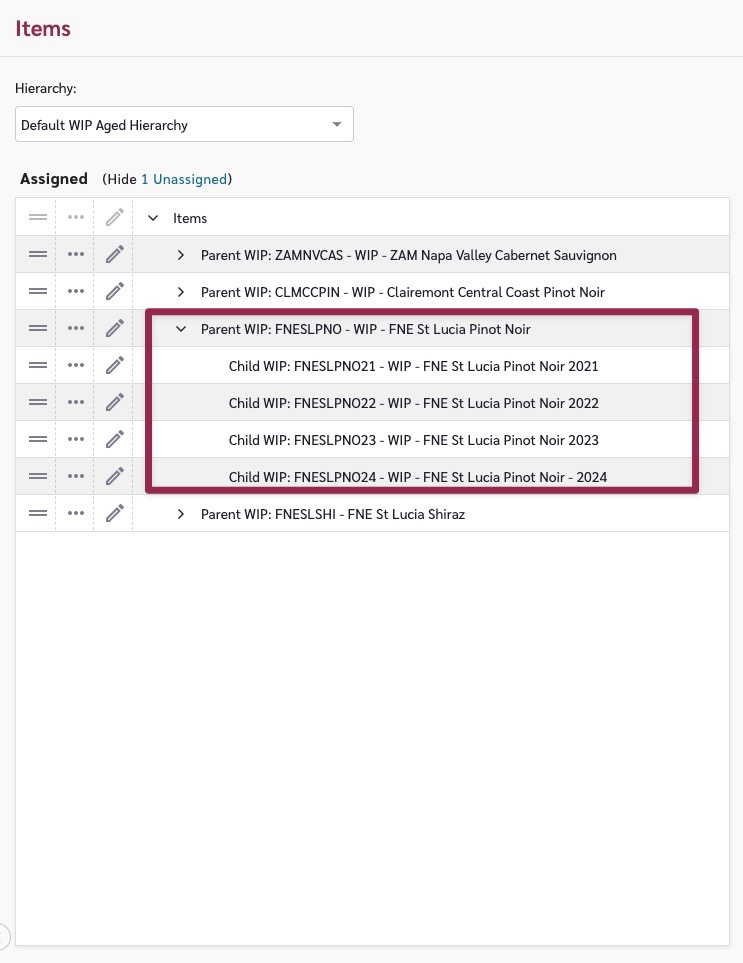
WIP Items have a two-level hierarchy (Parent WIP and Child WIP by vintage). Each Child WIP has a Routing, Age Start, and Vintage defined.
{% endhint %}

For detailed setup with screenshots, see [Make Planning Setup](/make/make-planning/make-planning-setup).

## Loading Data

1. **Sales Data** — Sales history and forecasts drive finished goods demand. Import at Settings > Transactional Data > [Sales](/transactional-data/sales)
2. **Inventory** — WIP and finished goods inventory. Import at Settings > Transactional Data > [Inventory](/transactional-data/inventory)
3. **Supply Plans** — Production plans if you have existing schedules. Import at Settings > Transactional Data > [Supply Plans](/transactional-data/supply-plans)

## What's Next

* [Make Planning](/make/make-planning) — detailed usage documentation
* [Setting Up Crop Supply Planning](/using-claret/getting-started/setting-up-modules/setting-up-crop-supply-planning) — if you need to plan raw material supply

## Verification

To verify Make Planning is set up correctly:

1. Navigate to Make > Make Planning
2. You should see your WIP items listed
3. Select a Parent WIP item — you should see its child vintages
4. The grid should show sales demand, inventory, supply plans, and position

**If the page is empty:**

* Verify WIP Items have been added to the Work in Process hierarchy
* Verify Recipes link WIP items to finished goods
* Verify Item @ Locations exist for WIP items

## Common Questions

### How does demand flow from finished goods to WIP?

Sales demand for finished goods is converted to WIP demand using Recipes. The recipe ratios determine how much of each WIP item is needed for each finished good.

### How are vintages assigned to forecast demand?

Forecast sales at the non-vintage level are apportioned across vintages based on the sell-date. A forecast sale is attributed to a vintage if it falls between the Ideal Release Date of that vintage and the next.


# Setting Up Crop Supply Planning

Step-by-step setup guide for Crop Supply Planning in Claret. Covers prerequisites, required master data, and verification steps for admin users.

Crop Supply Planning connects WIP production needs to raw material sourcing. It allows you to plan crop supply (e.g., grapes) against the dependent demand from Make Planning, track supply by vintage and location, and manage the gap between demand and available supply.

## What's Already Set Up

Claret seeds some data for new tenants. Before starting, check what already exists:

* **Calendars** — Default calendars have been created.
* **Varietals** — Some default varietals may exist. Review at Master Data > Varietals.
* **Vintages** — A set of vintages have been set up. Review at Master Data > Vintages.
* **Hierarchy Structures** — A default Raw Material hierarchy structure exists.

## Prerequisites

* Review [Global Settings](/using-claret/getting-started/global-settings) to confirm calendars, varietals, and vintages are configured
* Work out how you are going to manage your WIP/Bulk Supply Plans — Crop Supply Planning derives demand from WIP production plans. If you are using Make Planning, you can create your supply plans using this module. Alternatively, you can load required supply plans for WIP directly in as Supply Plans. See [Supply Types](/master-data/supply-types)
* WIP Items and Recipes linking WIP to crop items must exist

## Setup Steps

Crop Supply Planning requires the following master data to be configured:

| Step | Data                    | Description                                       | Instructions                                                    |
| ---- | ----------------------- | ------------------------------------------------- | --------------------------------------------------------------- |
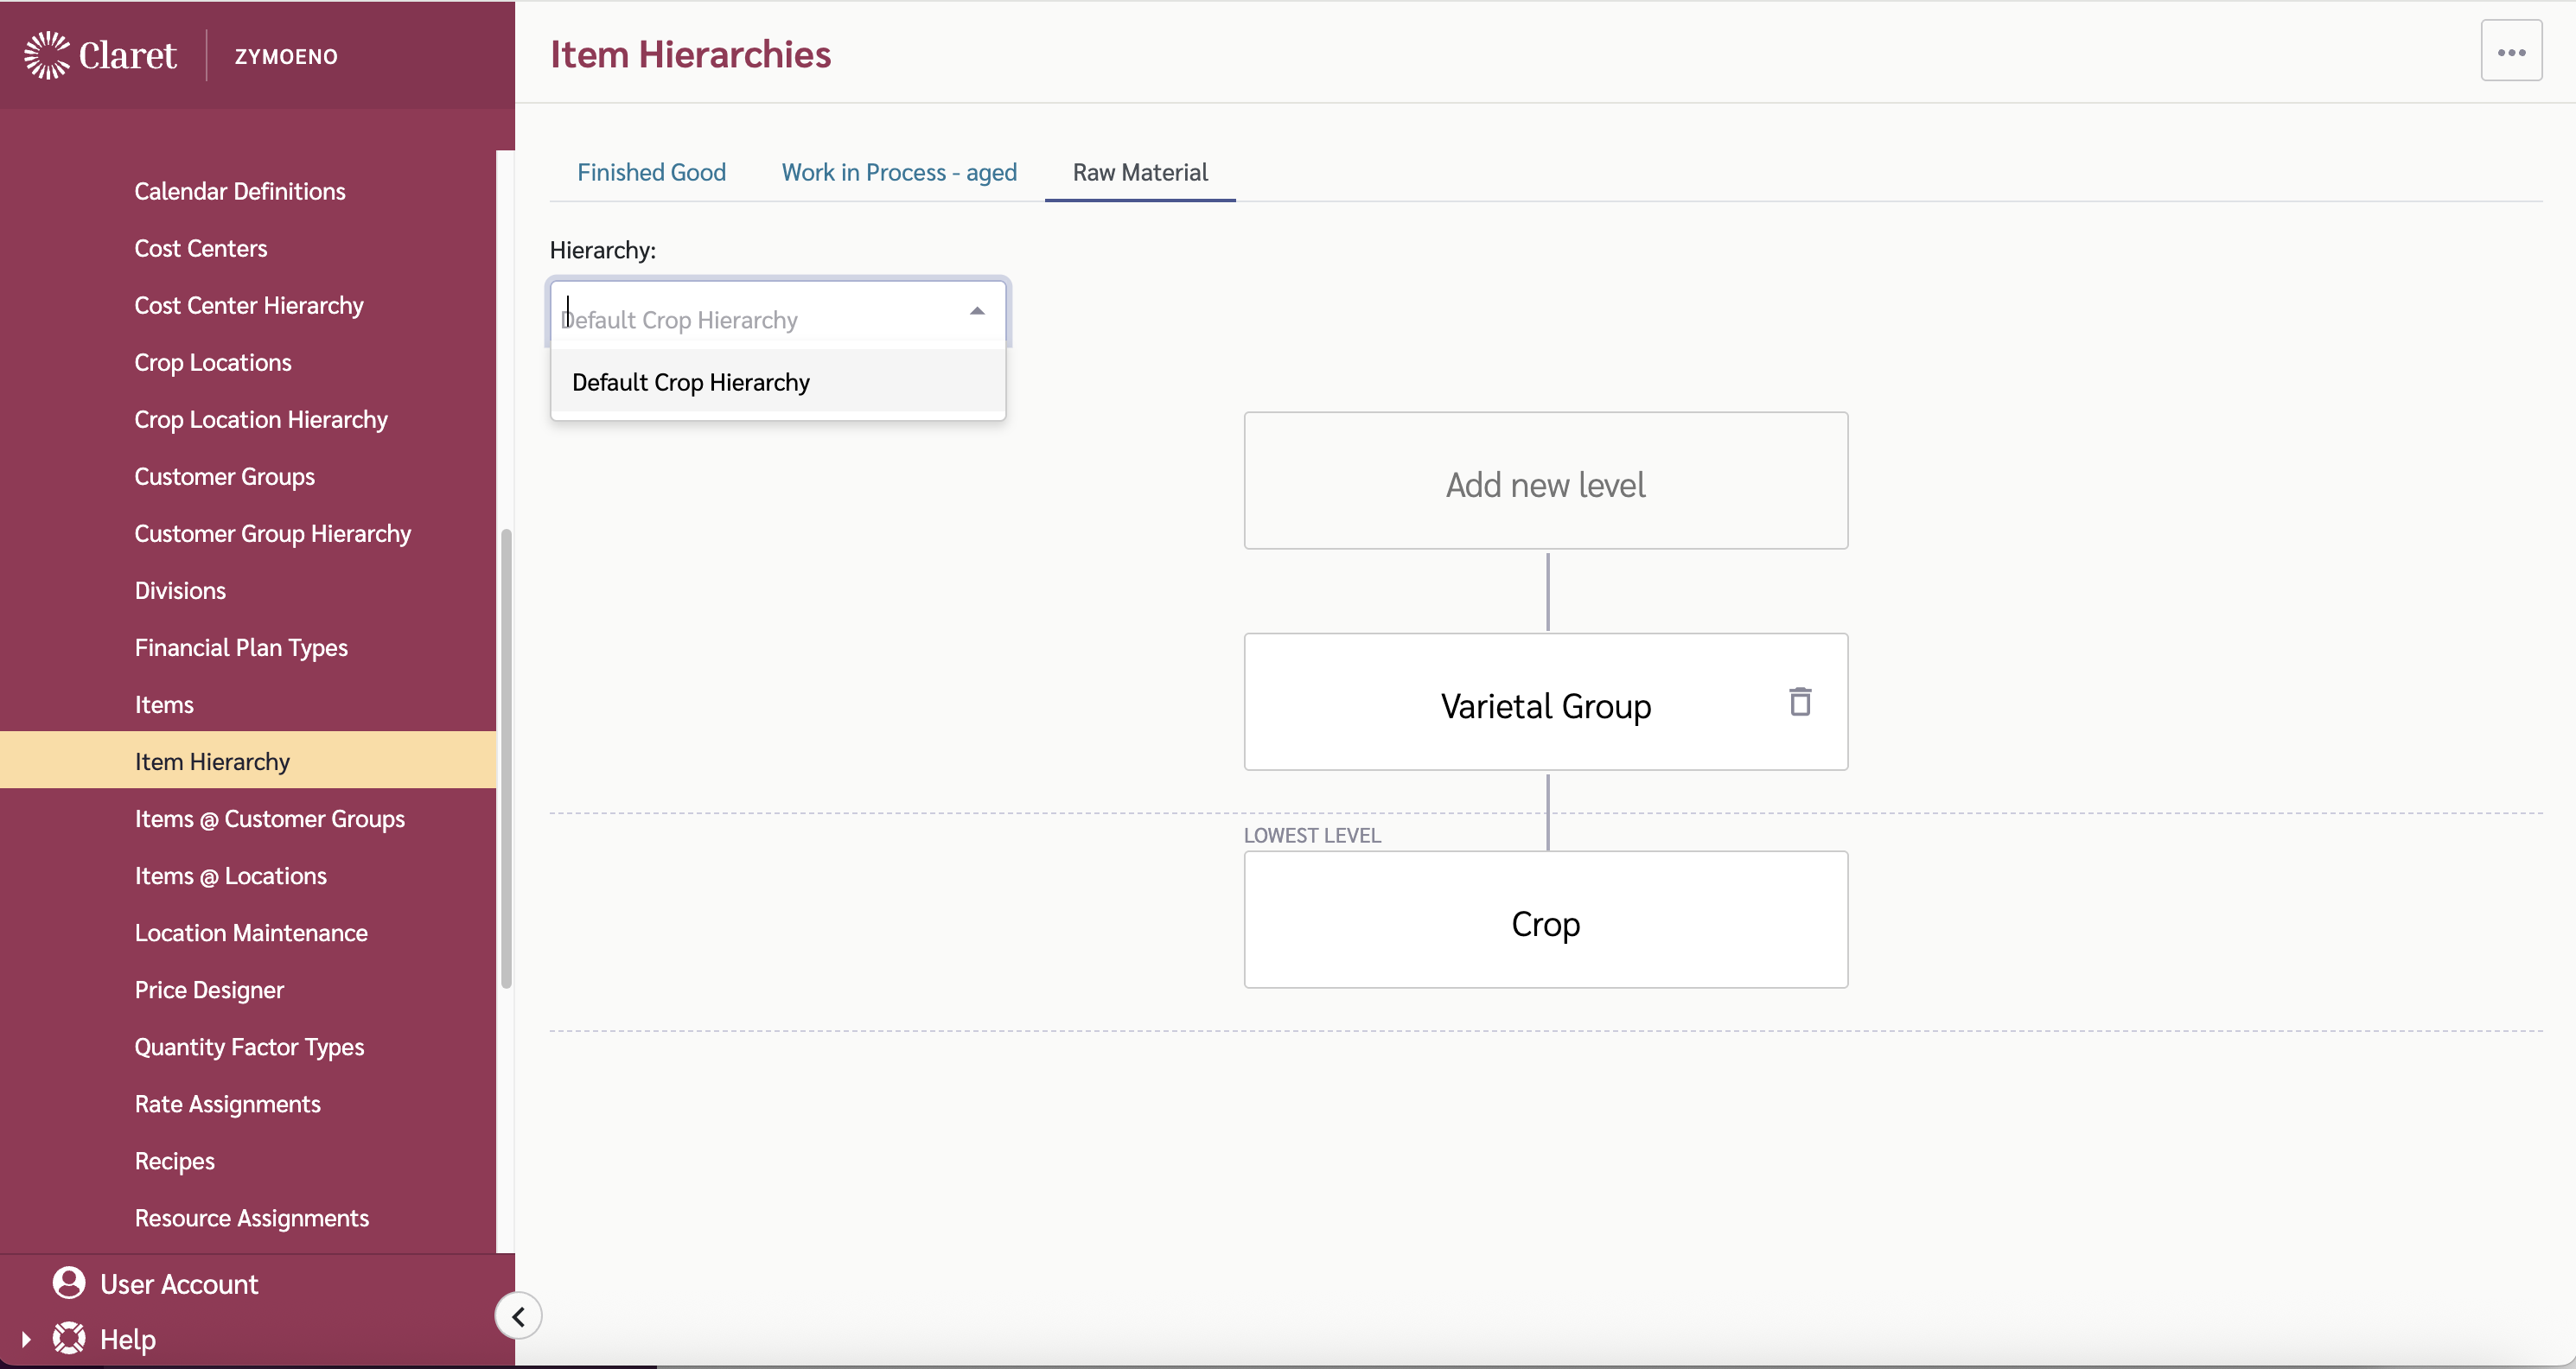
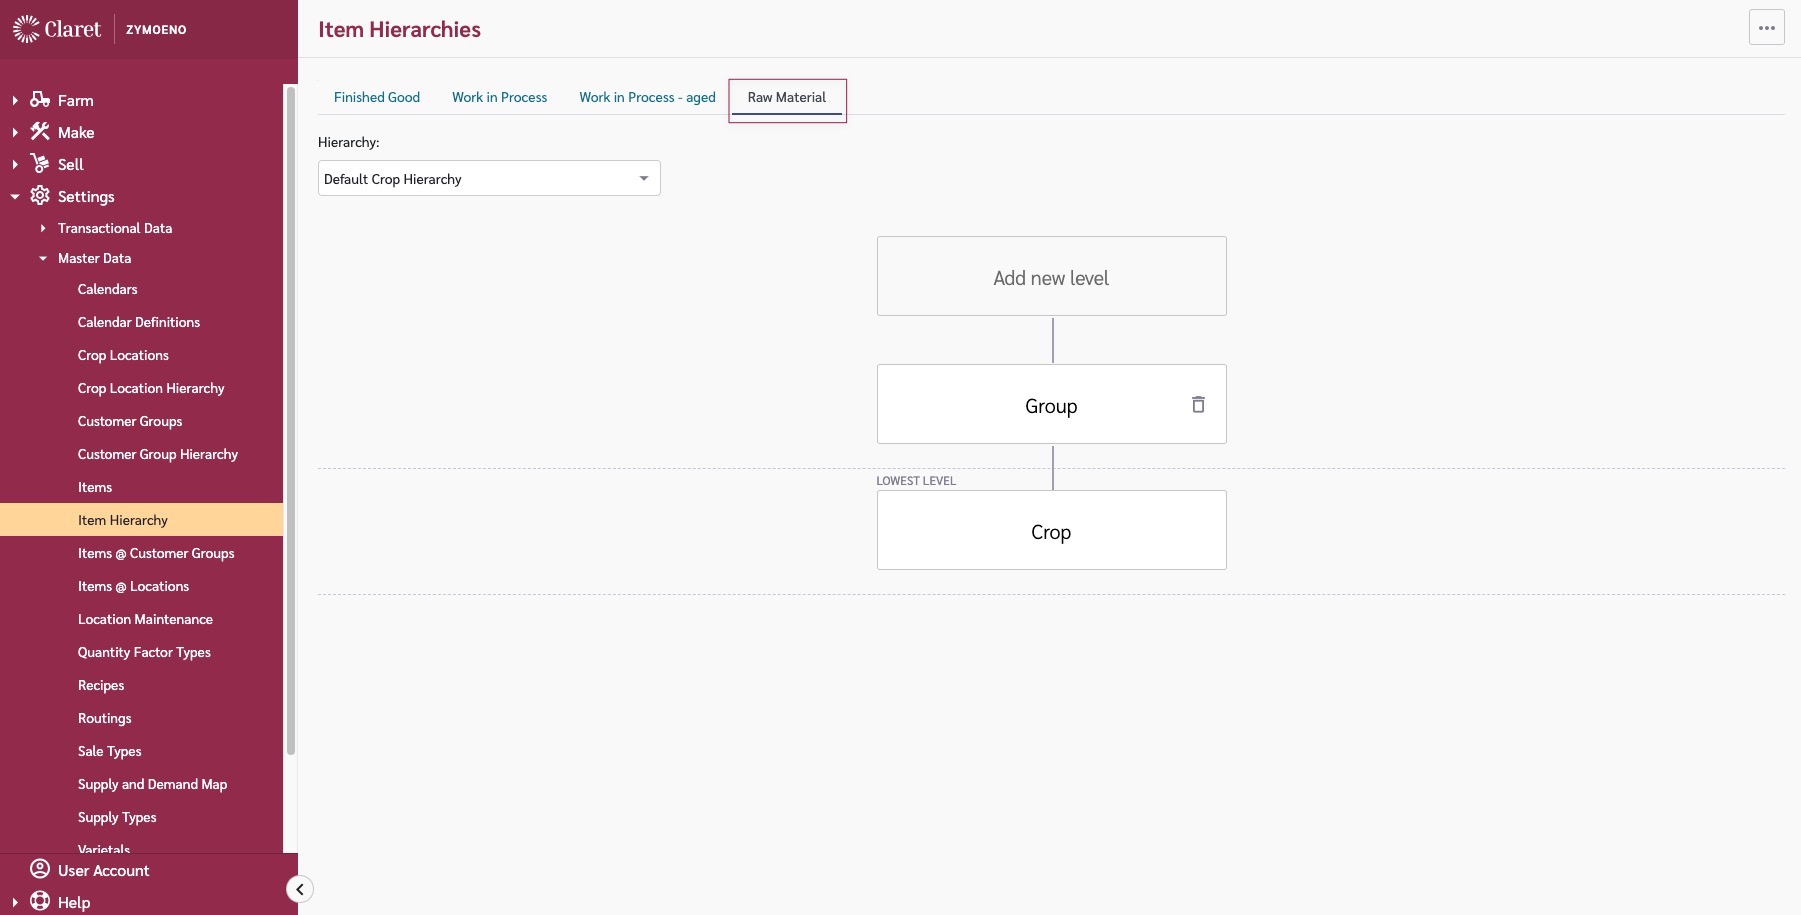
| 1    | Crop Item Hierarchy     | Raw material item hierarchy                       | [Item Hierarchy](/master-data/item-hierarchy)                   |
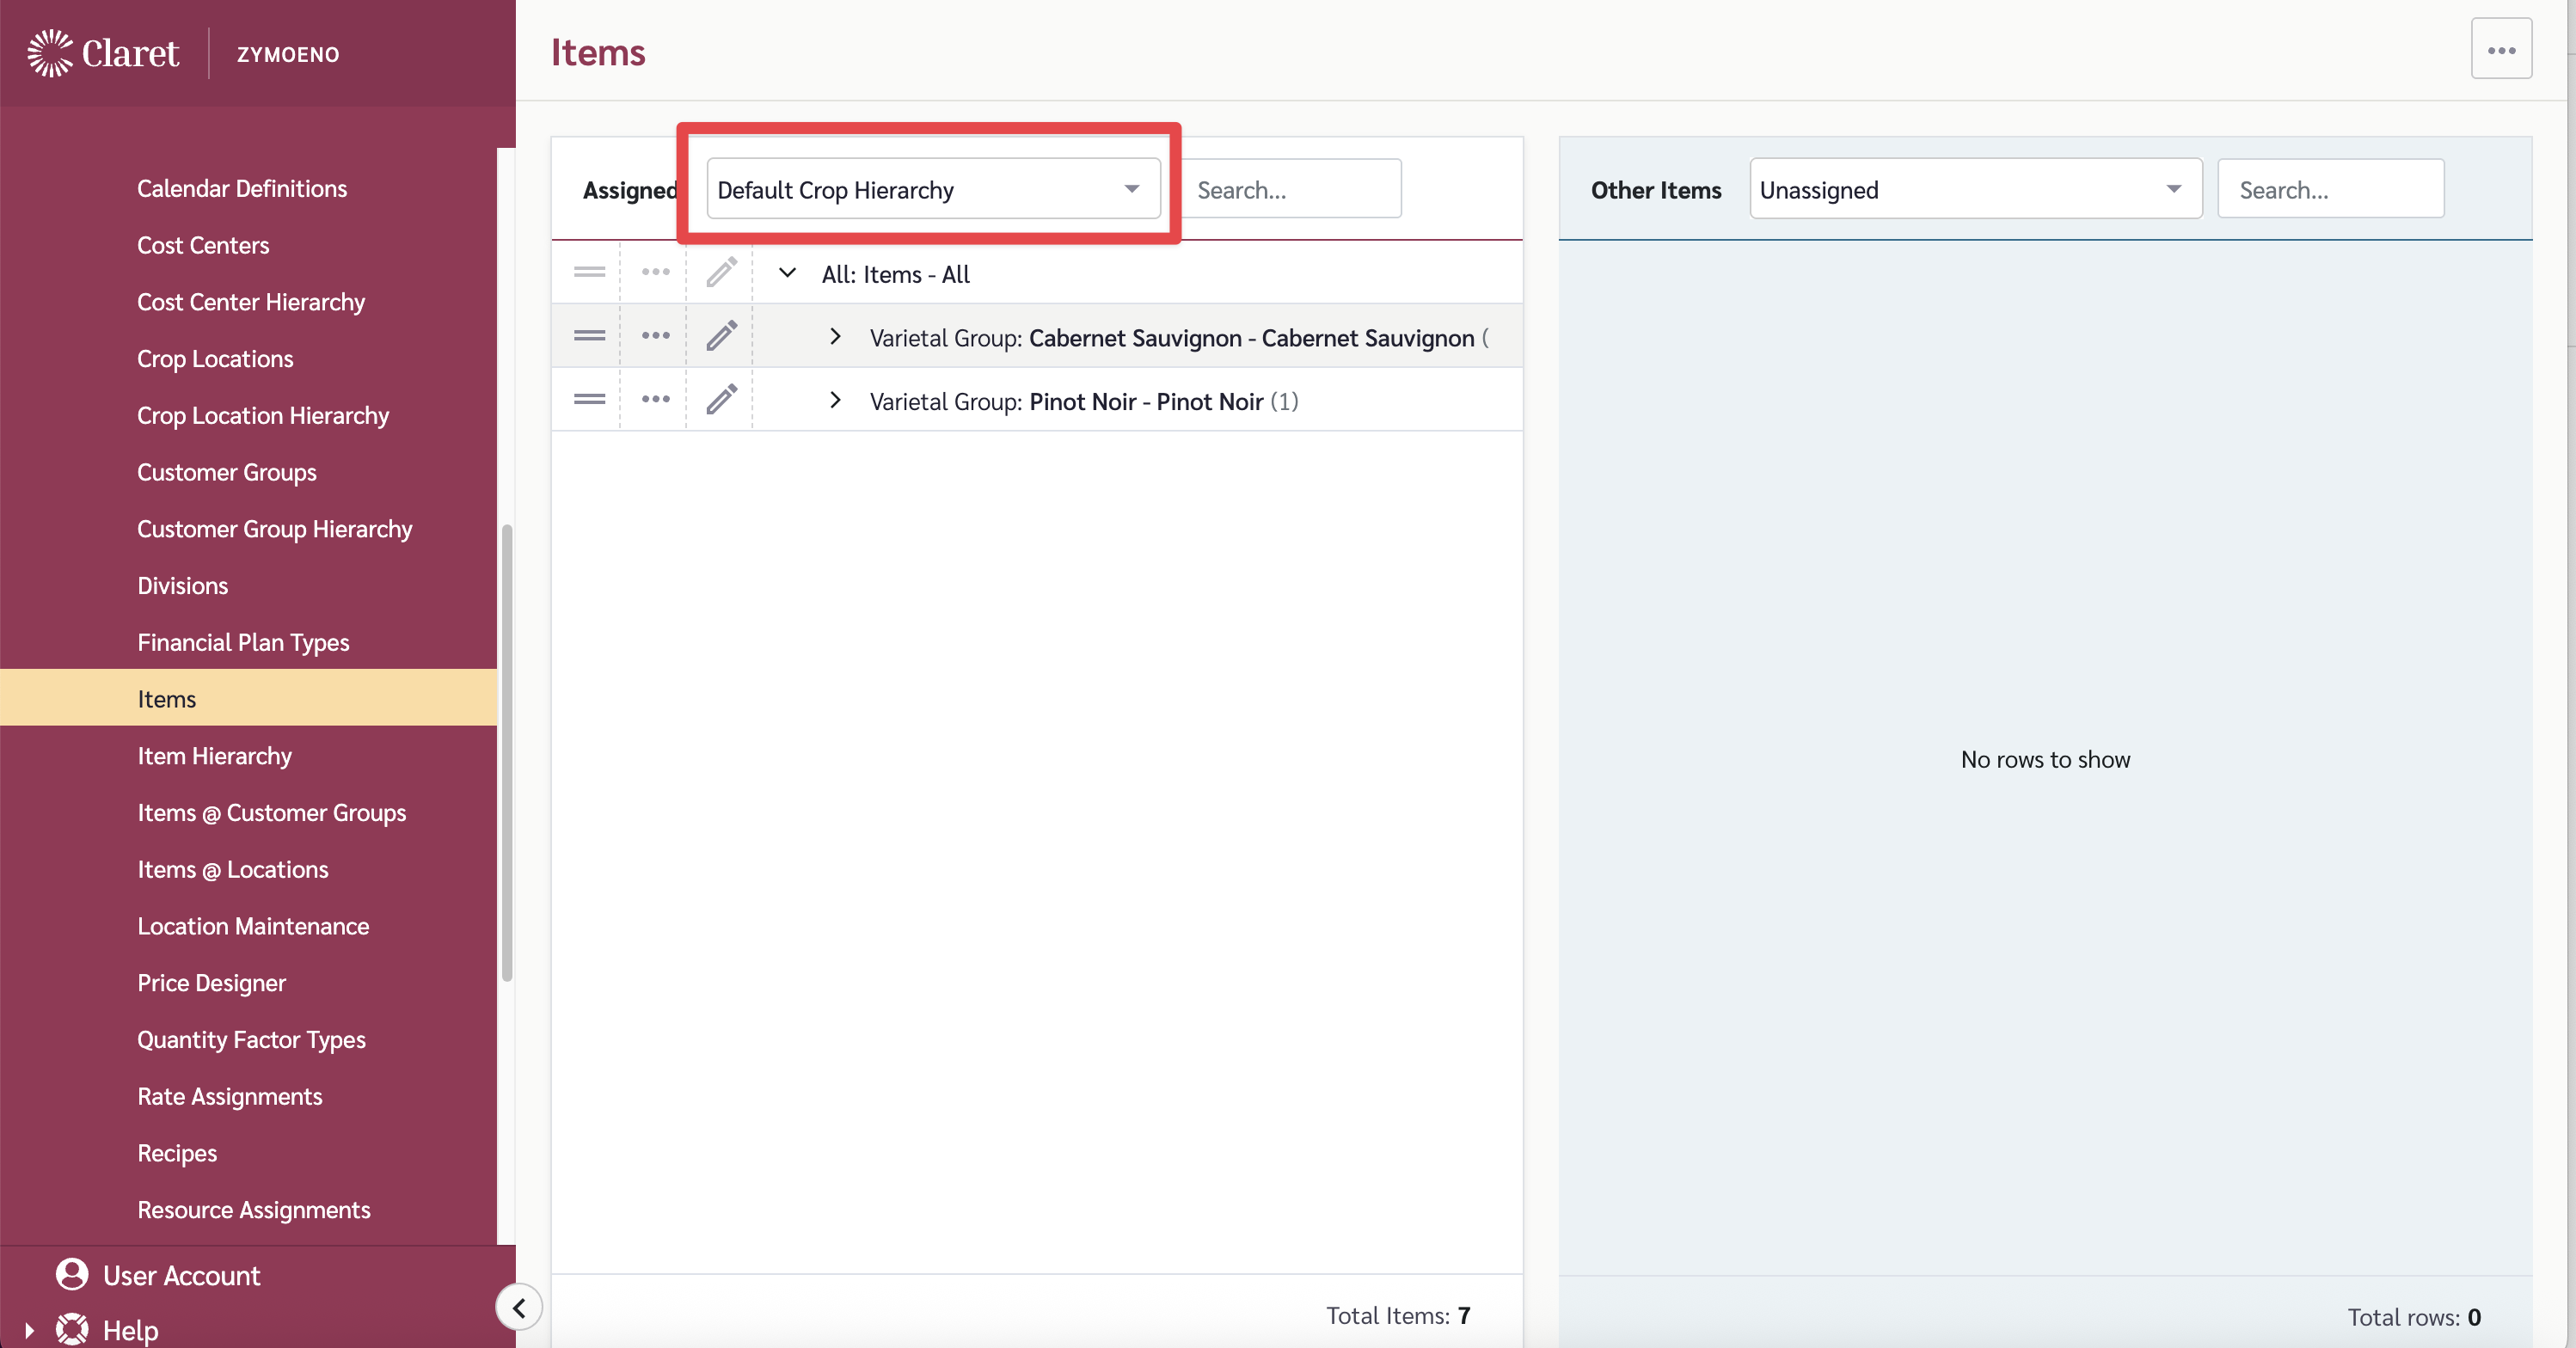
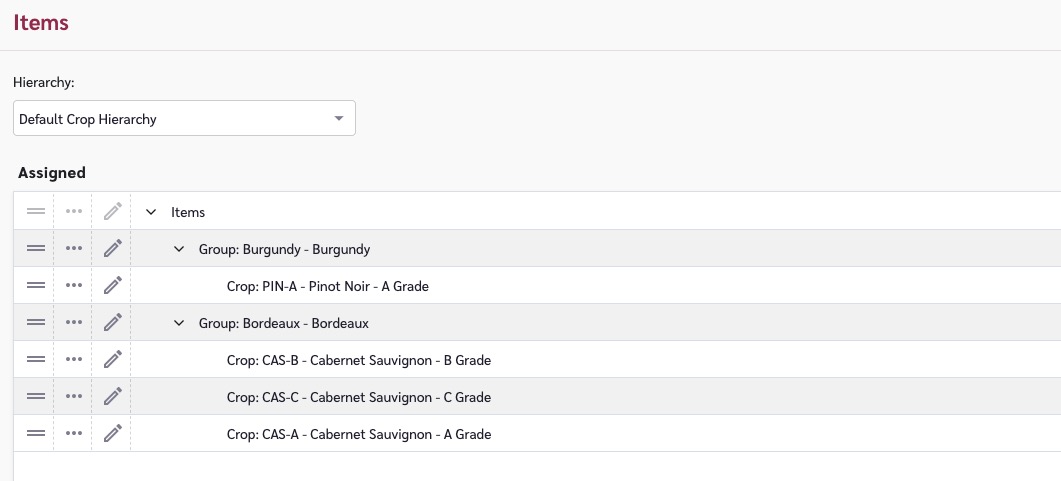
| 2    | Crop Items              | Raw material items (e.g., grape varieties)        | [Crop Items](/master-data/items/crop-items)                     |
| 3    | Crop Location Hierarchy | How crop locations are organized                  | [Crop Location Hierarchy](/master-data/crop-location-hierarchy) |
| 4    | Crop Locations          | Where you source or grow crops                    | [Crop Locations](/master-data/crop-locations)                   |
| 5    | Item @ Locations        | Which crop items are sourced from which locations | [Item @ Locations](/master-data/item-locations)                 |
| 6    | Recipes (WIP → Crop)    | Connect WIP items to the crop items they require  | [Recipes](/master-data/recipes)                                 |
| 7    | Supply Types            | For crop supply plans                             | [Supply Types](/master-data/supply-types)                       |

{% hint style="info" %}
Recipes linking WIP items to crop items define the raw material requirements. For example, a recipe might specify that 1 gallon of Chardonnay WIP requires 1.5 lbs of Chardonnay grapes.
{% endhint %}

For detailed setup with screenshots, see [Crop Supply Planning Setup](/farm/crop-supply-planning/crop-supply-planning-setup).

## Loading Data

1. **Supply Plans (WIP)** — WIP make volumes from Make Planning drive dependent demand. These should already exist if Make Planning is set up. Alternatively these can be entered directly as [Supply Plans](/transactional-data/supply-plans)
2. **Supply Plans (Crop)** — Planned harvest volumes. Can be entered directly in Crop Supply Planning or imported at Settings > Transactional Data > [Supply Plans](/transactional-data/supply-plans)

## What's Next

* [Crop Supply Planning](/farm/crop-supply-planning) — detailed usage documentation

## Verification

To verify Crop Supply Planning is set up correctly:

1. Navigate to Farm > Crop Supply Planning
2. Configure a view with your Crop Item Hierarchy
3. You should see your crop items listed
4. The grid should show dependent demand (from WIP), planned supply, and delta (surplus/deficit)

**If no demand appears:**

* Verify WIP Supply Plans exist (Make Planning must have production plans)
* Verify Recipes link WIP items to crop items
* Verify Item @ Locations exist for crop items at crop locations

## Common Questions

### How is dependent demand calculated?

Dependent demand is calculated from WIP make volumes using Recipe ratios. If a recipe says 1 gallon of WIP requires 1.5 lbs of grapes, and you plan to make 1000 gallons, the dependent demand for grapes is 1500 lbs.

### What does delta (surplus/deficit) mean?

Delta = Planned Supply - Dependent Demand. A positive delta means surplus (more supply than needed). A negative delta means deficit (more demand than supply).

### Do I need Make Planning to use Crop Supply Planning?

No. Crop Supply Planning can derive its demand from WIP production plans in Make Planning, but these can also be entered directly.


# Transactional Data

Easily manage sales, inventory and supply plans data to keep processes efficient and timely. Get started now and discover how easy it is to stay on top of transactional information.

### Which Data Does Each Module Need?

| Module                         | Sales Data         | Inventory | Supply Plans |
| ------------------------------ | ------------------ | --------- | ------------ |
| Sales Collaboration            | ✓                  |           |              |
| Long Term Planning             | ✓                  |           |              |
| Forecast Workbench             | ✓                  |           |              |
| Inventory Workbench - Partner  | ✓                  | ✓         |              |
| Inventory Workbench - Internal | ✓                  | ✓         | ✓            |
| Make Planning                  | ✓ History/Forecast | ✓         | ✓            |
| Crop Supply Planning           |                    |           | ✓            |

### Sales Data

Sales data is stored against Item @ Customer Group combinations and categorized by Sale Type (e.g., History, Budget, Forecast).

**Where to import:** Settings > Transactional Data > [Sales](/transactional-data/sales)

**Import methods:**

* **Manual entry** — Add individual records via the UI
* **Bulk import** — Upload CSV/Excel files using the claret-sales-import-example.csv template
* **API** — Use the [Sales API](/api-guide/migration/sales-data) for automated integrations

**Used by:**

* **Sales Collaboration** — Enter and manage sales plans
* **Long Term Planning** — Reference history when building annual plans (Growth % feature)
* **Forecast Workbench** — Historical data is required to generate statistical forecasts
* **Make Planning** — Sales demand drives WIP production requirements
* **Inventory Workbenches** — Demand/depletion data drives DOH calculations

### Inventory

Inventory data is stored against Item @ Location combinations and tracks current stock levels.

**Where to import:** Settings > Transactional Data > [Inventory](/transactional-data/inventory)

**Import methods:**

* **Manual entry** — Add individual records via the UI
* **Bulk import** — Upload CSV files using the claret-inventory-import-example.csv template
* **API** — Use the [Inventory API](/api-guide/migration/inventory) for automated integrations

**Used by:**

* **Make Planning** — Starting inventory for WIP and finished goods
* **Inventory Workbench - Internal** — Current stock at your locations
* **Inventory Workbench - Partner** — Current stock at partner locations

### Supply Plans

Supply plans represent planned production, shipments, or sourcing volumes. They're stored against items (and optionally locations) and categorized by Supply Type.

**Where to import:** Settings > Transactional Data > [Supply Plans](/transactional-data/supply-plans)

**Import methods:**

* **Manual entry** — Add individual records via the UI
* **Bulk import** — Upload files using the template
* **API** — Use the [Supply Plans API](/api-guide/migration/supply-plans-data) for automated integrations
* **Generated by Claret** — Inventory Workbench can generate supply plans automatically

**Used by:**

* **Make Planning** — WIP production plans
* **Crop Supply Planning** — WIP plans drive dependent demand; crop supply plans track harvest volumes
* **Inventory Workbench - Internal** — Production planning and supply plan generation

### Data Freshness

How often should you update transactional data?

| Data Type       | Recommended Frequency | Notes                               |
| --------------- | --------------------- | ----------------------------------- |
| Sales History   | Weekly or Monthly     | Depends on your data availability   |
| Sales Forecasts | Monthly or Quarterly  | Update as plans change              |
| Inventory       | Daily or Weekly       | More frequent = more accurate DOH   |
| Supply Plans    | As needed             | Update when production plans change |

{% hint style="info" %}
Transactional data can be updated manually, via bulk import, or automated through the API. Many organizations set up scheduled API imports to keep data current.
{% endhint %}


# Managing Views

Learn how to manage and customize views in Claret for a personalized data display experience. Explore workspace and personal views, and understand how to create, edit, and use them effectively.

Within Claret we use Views to allow users to customise how they see data. How you see data on many Claret pages depends on how views are configured. A view is a layout, with defined columns, filters and formulas. Having multiple views of data can help you quickly move between different ways of seeing things.

There are 2 types of Views within Claret:

1. Workspace Views - these are views that have been set up by administrator users for your company. All users have access to these views.
2. Personal Views - these are views specific to you, and only seen by you. When you create a view, it will be a personal view by default unless you are an administrator and able to mark it as a workspace view. You can have as many personal views as you like.

View functionality is currently available for:

* Forecast Workbench
* Long Term Planning
* Sales Collaboration
* Sales
* Make Planning
* Crop Supply Planning

At any time, the name of the view you are currently on can be seen in the top right of the header bar.

![](/files/IZtku2IAszsKTQ21JT0q)

Details on how to create views for each module can be found within the module documentation.


# Crop Supply Planning

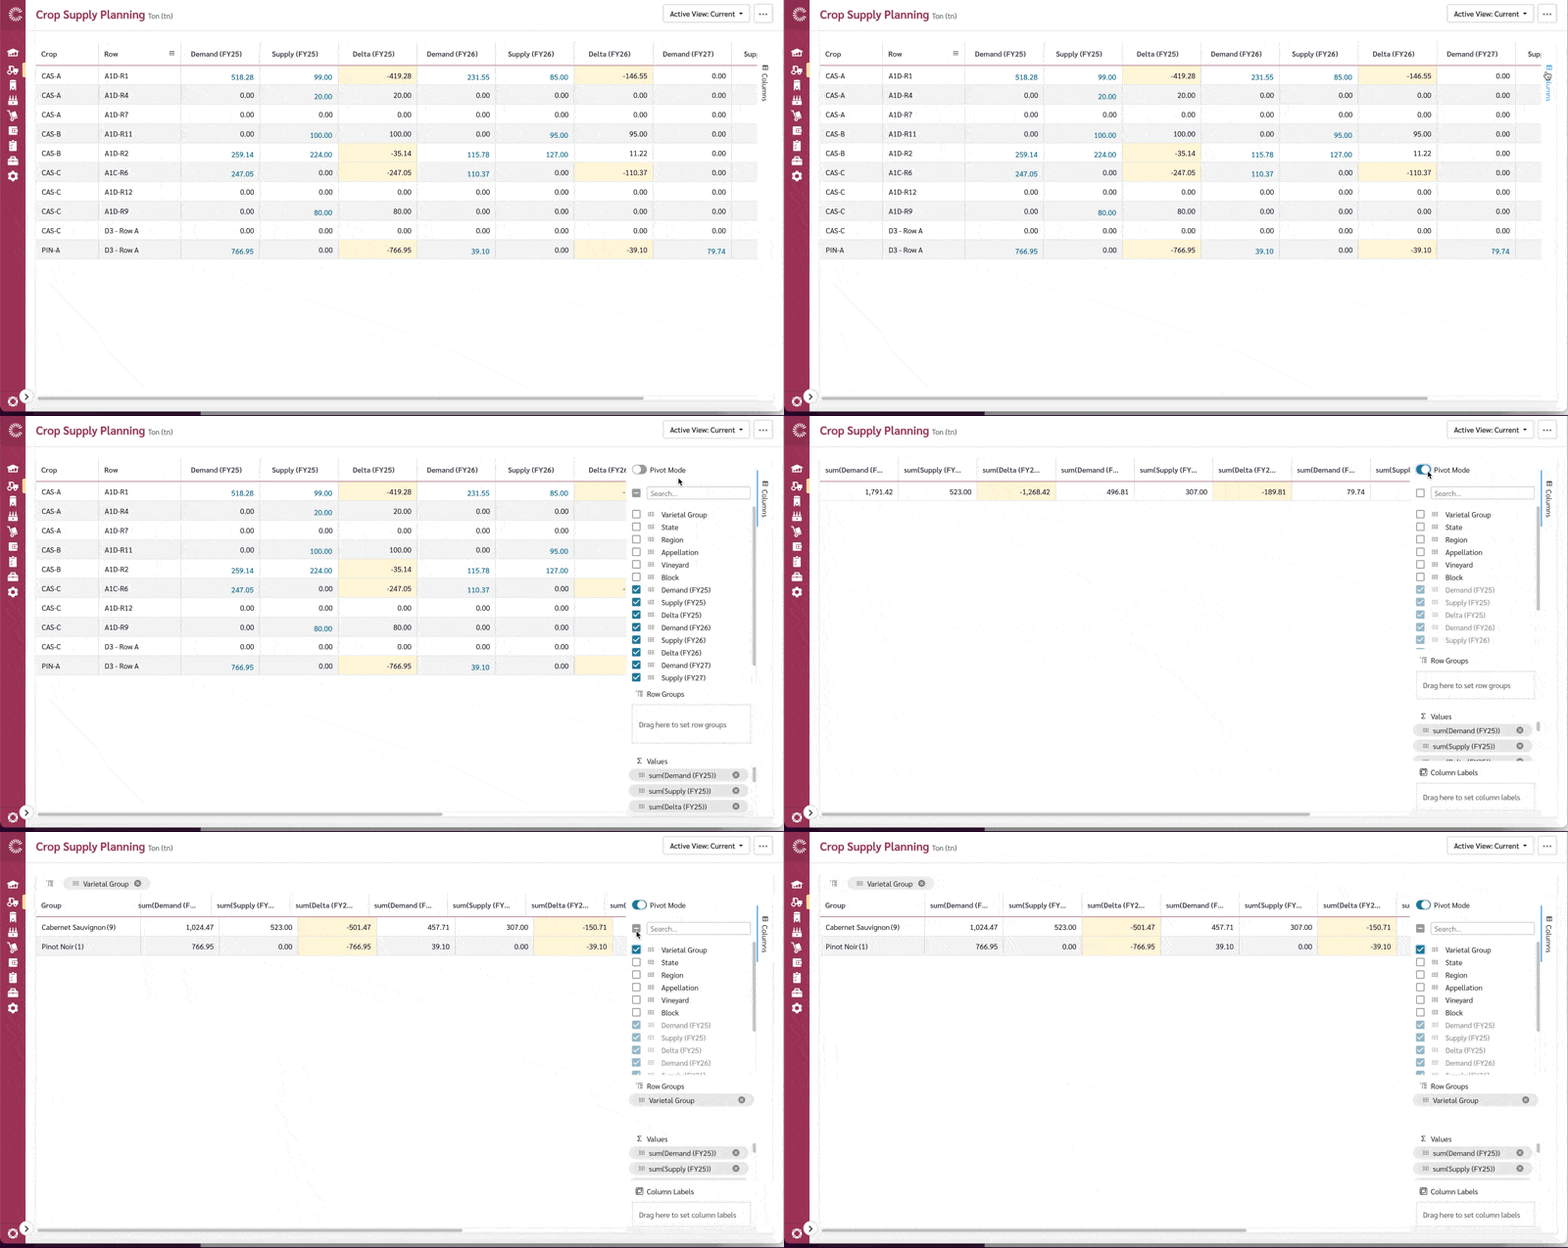
See your crop position into the future and prepare for and manage surpluses and deficits in plenty of time.

Managing crop supply across multiple varietals and crop locations is complex. It's a challenge that requires careful coordination between crop demand for each vintage and available crop supply from various vineyard locations and suppliers. Claret has a dedicated module - 'Crop Supply Planning' - designed just for this.

The Crop Supply Planning module brings together, in one place, your

* Crop Demand (from Make Planning requirements, direct demand, and Sales)
* Crop Supply (from Supply Plans)
* Deficit/Surplus calculations by fiscal year

This then allows you to see the overall position - whether you have sufficient crop supply to meet demand, or if there is a deficit or surplus.

{% hint style="info" %}
For the Crop Supply Planning module to work correctly there will need to be some Master Data set up. For details please visit [Crop Supply Planning Setup](/farm/crop-supply-planning/crop-supply-planning-setup)
{% endhint %}

### **Viewing the Crop Supply Plan**

To access the Crop Supply Planning module, go to the Farm module and select 'Crop Supply Planning'

<figure><img src="/files/vHl3V4suKfGhHGwM251o" alt="Crop Supply Planning navigation"><figcaption></figcaption></figure>

The main 'Crop Supply Planning' page is where the magic happens.

The Crop Supply Planning Grid will then display based on your view configuration.

<figure><img src="/files/N2bpTGUoJYoDho5sKmQg" alt="The Crop Supply Planning Main Grid"><figcaption></figcaption></figure>

The data displayed in the grid will depend on your view configuration. To set this up, select the view menu in the top right of your screen

<figure><img src="/files/X72cUCMSS27nT0rGs5KA" alt="Crop Supply Planning View Configuration option"><figcaption></figcaption></figure>

The view configuration screen then lets you set the data to use in the view.

<figure><img src="/files/2zFopEZfiG8AgZ59bkT7" alt="Crop Supply Planning View Configuration"><figcaption></figcaption></figure>

Options are required for:

* Raw Material Hierarchy Type - The Crop item hierarchy you wish to work with
* Crop Location Hierarchy Type - The Crop Location hierarchy you wish to work with
* UOM - The Unit of Measure the data will be displayed in
* Calendars - The fiscal year calendars you wish to display data for (you can select multiple calendars to view data across multiple fiscal years)
* Supply Status - The supply plan statuses to include in the data
* Dependent Demand - The supply types from which crop demand will be calculated (typically this will be WIP supply plans). Crop demand is then calculated using recipes connecting the WIP items to your crop items. Note that these recipes must be at the
* Contract Demand - Whether to include demand from contract allocations
* Crop Supply - The supply types that contain crop supply data

### The Crop Supply Planning Grid

The Crop Supply Planning grid displays crop demand, crop supply, and the delta (deficit/surplus) for each crop item and location combination, broken down by fiscal year.

{% hint style="info" %}
The relationships between Crop Items and Crop Locations are set on the [Item @ Locations](/master-data/item-locations) page. A row will appear in the Crop Supply Planning grid for every combination of item and location that is set up on this page.
{% endhint %}

#### Hierarchy Columns

The first set of columns relate to the hierarchy levels for both Crop Items and Crop Locations.

<figure><img src="/files/rjBBJ9OROkvU9M5hOC4N" alt="Crop Supply Planning Grid with Hierarchy Levels"><figcaption></figcaption></figure>

These columns show the hierarchy structure for your crops and locations, allowing you to group and filter data by different hierarchy levels.

To add more of your hierarchy levels into the grid, select the 'Columns' section on the right of the grid. This will expand a column selector and you can select further columns to display.

<figure><img src="/files/alCG5ejKiBX1rzGgA84S" alt="Crop Supply Planning Column Selector"><figcaption></figcaption></figure>

{% hint style="info" %}
To update hierarchy details, go to the [Crop Locations](/master-data/crop-locations) and [Items](/master-data/items) pages.
{% endhint %}

#### Demand, Supply, and Delta by Fiscal Year

For each fiscal year (calendar) selected in your view configuration, the grid will display three columns:

<figure><img src="/files/PZ0ypG0JFoPHZdFaFbbi" alt="Crop Supply Planning fiscal year columns"><figcaption></figcaption></figure>

1. **Demand** - The total crop demand for the fiscal year. This is calculated from:
   * Dependent Demand - derived from Supply Plans (typically WIP make plans, which use recipes to determine how much crop is required)
   * Contract Allocations - if you have selected to include contract demand in your configuration
   * Independent Demand - derived from Sales data (if configured)
2. **Supply** - The total crop supply for the fiscal year from the Supply Plans configured in your view
3. **Delta** - The difference between Supply and Demand (calculated as Supply minus Demand)
   * A positive number indicates you have more supply than demand (surplus)
   * A negative number indicates you have less supply than demand (deficit), and will be highlighted in yellow

{% hint style="info" %}
You can select multiple calendars in the view configuration to compare demand, supply, and delta across multiple fiscal years side by side.
{% endhint %}

#### Grouping and Filtering Data

The grid allows you to group and filter data by different hierarchy levels, making it easy to see the overall position at different levels of detail.

{% hint style="info" %}
You can sort the grid by any of the visible columns, simply by clicking on the header name.

To filter any of the columns, click on the hamburger icon, and then select the filter option you require.
{% endhint %}

### Exporting Data

You can export the Crop Supply Planning data to CSV by clicking the Options menu and selecting Export.

<figure><img src="/files/sRfr2tmgyOaIEQ51Gye9" alt="Export Crop data"><figcaption></figcaption></figure>

### Charting Data

Another feature of Crop Supply Planning is the ability to chart the data displayed in the grid at any time.

To create a chart of your data, simply highlight the cells you would like to chart, and right click and select 'Chart Range'.

<figure><img src="/files/CpAxbvxnJKD8FP4xaVxV" alt="Chart Crop data"><figcaption></figcaption></figure>

There are a number of Chart formats available and you can select the option that best fits your needs.

### Using Pivot Mode

Pivot Mode is a powerful feature that allows you to reorganize and summarize your crop supply planning data by transforming columns into rows and vice versa. This is particularly useful when you want to analyze your data from different perspectives.

#### Enabling Pivot Mode

To enable Pivot Mode:

1. Open the Columns panel by clicking the 'Columns' button on the right side of the grid
2. At the top of the Columns panel, you'll see a 'Pivot Mode' toggle
3. Click the toggle to turn on Pivot Mode

<figure><img src="/files/qx0TNFqyiGb0qyzVkPVL" alt="Access Pivot Mode"><figcaption></figcaption></figure>

{% hint style="info" %}
When you enable Pivot Mode, the grid will transform to show your data in a pivoted view. You can toggle it off at any time to return to the standard view.
{% endhint %}

#### How Pivot Mode Works

Once Pivot Mode is enabled, you can reorganize your data by:

**Row Groups** - Hierarchy columns can be dragged to the Row Groups area to group data by those dimensions. For example:

* Group by Crop Item hierarchy levels to see totals by variety or other crop classifications in your hierarchy
* Group by Crop Location hierarchy levels to see totals by region, vineyard, or other location classifications in your hierarchy

**Pivot Columns** - Hierarchy columns can be dragged to the Pivot area to transform those values into column headers. For example:

* Pivot by a crop location level to create separate columns for each location
* Pivot by a crop item level to create separate columns for each item classification

**Values** - The Demand, Supply, and Delta columns will automatically aggregate (sum) based on your row groups and pivot selections

#### Tips for Using Pivot Mode

* **Experiment with different combinations** - Try dragging different hierarchy levels to Row Groups vs Pivot areas to find the most useful view for your analysis
* **Clear and start over** - If you want to reset, simply drag items back out of the Row Groups and Pivot areas
* **Export pivoted data** - You can export your pivoted view to CSV to share or analyze further in Excel
* **Turn off when done** - Toggle Pivot Mode off to return to the standard flat view of all item-location combinations


# Quick Start: Crop Supply Planning

Quick start guide for Crop Supply Planning — how to configure a view, read demand, supply, and delta data, use pivot mode, and export data.

## What You'll Learn

Crop Supply Planning helps you manage crop supply across varietals and locations by showing demand, supply, and the surplus or deficit (delta) for each combination. After this guide, you'll be able to navigate to the module, configure a view, read the grid, use pivot mode, and export data.

## Before You Begin

Your admin should have already:

* Set up Crop Items, Crop Locations, and Item @ Locations
* Configured Recipes linking WIP items to crop items
* Set up Crop Location Hierarchies
* Imported supply plan data

If the module shows no data, check with your admin that setup is complete. See [Setting Up Crop Supply Planning](/using-claret/getting-started/setting-up-modules/setting-up-crop-supply-planning) for what's required.

## Step 1: Access Crop Supply Planning

Navigate to **Farm > Crop Supply Planning** in the left navigation menu.

<figure><img src="/files/vHl3V4suKfGhHGwM251o" alt="Crop Supply Planning navigation"><figcaption><p>The Crop Supply Planning menu item in the navigation</p></figcaption></figure>

## Step 2: Configure or Select a View

1. Click the **view menu** in the top-right of the page
2. Select an existing workspace view, or create a new view with these settings:
   * **Raw Material Hierarchy Type** — the crop item hierarchy to use
   * **Crop Location Hierarchy Type** — the crop location hierarchy to use
   * **UOM** — the unit of measure for displaying data
   * **Calendars** — select one or more fiscal year calendars to display
   * **Supply Status** — which supply plan statuses to include
   * **Dependent Demand** — the supply types from which crop demand is calculated (typically WIP supply plans)
   * **Crop Supply** — the supply types containing crop supply data

<figure><img src="/files/2zFopEZfiG8AgZ59bkT7" alt="Crop Supply Planning View Configuration"><figcaption><p>The Crop Supply Planning view configuration screen</p></figcaption></figure>

## Step 3: Read the Grid

The Crop Supply Planning grid shows one row per crop item and location combination:

| Column Group          | What It Shows                                                                                           |
| --------------------- | ------------------------------------------------------------------------------------------------------- |
| **Hierarchy columns** | Crop item and crop location identifiers                                                                 |
| **Demand**            | Crop demand for each fiscal year — calculated from dependent demand (WIP recipes) and any direct demand |
| **Supply**            | Crop supply for each fiscal year — from supply plans                                                    |
| **Delta**             | The difference between supply and demand for each fiscal year                                           |

**Interpreting the delta:**

* **Positive delta** = surplus (you have more supply than demand)
* **Negative delta** = deficit (demand exceeds supply — action may be needed)

<figure><img src="/files/PZ0ypG0JFoPHZdFaFbbi" alt="Crop Supply Planning fiscal year columns"><figcaption><p>The Crop Supply Planning grid showing demand, supply, and delta columns per fiscal year</p></figcaption></figure>

## Step 4: Group and Filter Data

* **Expand/collapse rows** — click the arrows next to hierarchy items to drill down into detail
* **Filter** — use column header filters to narrow data to specific items or locations
* **Sort** — click column headers to sort by demand, supply, or delta values

<figure><img src="/files/rjBBJ9OROkvU9M5hOC4N" alt="Crop Supply Planning Grid with Hierarchy Levels"><figcaption><p>Expand hierarchy rows to drill down to lower levels of detail</p></figcaption></figure>

## Step 5: Use Pivot Mode (Optional)

Pivot mode lets you reshape the grid for advanced analysis:

1. **Enable Pivot Mode** from the grid toolbar
2. Configure:
   * **Row Groups** — what to group rows by (e.g., Varietal)
   * **Pivot Columns** — what to pivot on (e.g., Crop Location)
   * **Values** — which measures to display (Demand, Supply, Delta)
3. The grid reshapes to show a cross-tabulation of your data

<figure><img src="/files/qx0TNFqyiGb0qyzVkPVL" alt="Access Pivot Mode"><figcaption><p>Enabling Pivot Mode and configuring row groups, pivot columns, and values</p></figcaption></figure>

{% hint style="info" %}
Pivot mode is powerful for comparing supply positions across locations for the same varietal, or comparing varietals within a location.
{% endhint %}

## Step 6: Export Data

To export the current grid data:

1. Right-click on the grid to open the context menu
2. Select **Export** to download the data as a CSV file

The export includes all visible rows and columns based on your current view and filter settings.

<figure><img src="/files/sRfr2tmgyOaIEQ51Gye9" alt="Export Crop data"><figcaption><p>Exporting the grid data as CSV from the context menu</p></figcaption></figure>

## Understanding the Data

| Term                 | What It Means                                                                                                                                                                      |
| -------------------- | ---------------------------------------------------------------------------------------------------------------------------------------------------------------------------------- |
| **Dependent Demand** | Crop demand calculated from WIP supply plans via recipes — e.g., if Make Planning says you need 100 tonnes of WIP Pinot Noir, recipes determine how much crop Pinot Noir is needed |
| **Direct Demand**    | Crop demand entered directly, not derived from recipes                                                                                                                             |
| **Delta**            | Supply minus demand. Watch for negative deltas — these indicate potential shortfalls                                                                                               |

## Common Questions

### Where does crop demand come from?

Crop demand is calculated from WIP (bulk) supply plans. Recipes define how much of a crop item is needed to make each WIP and these are used to translate the WIP demand to crop demand. The "Dependent Demand" setting in the view configuration controls which supply types feed this calculation.

### What does a negative delta mean?

A negative delta means demand exceeds supply for that crop item and location. You may need to source additional supply, adjust production plans, or revise demand forecasts.

### Can I view data across multiple fiscal years?

Yes. In the view configuration, select multiple calendars. The grid will show demand, supply, and delta columns for each fiscal year, letting you compare positions year over year.


# Crop Supply Planning Setup

Set up your Crop Supply Plan in Claret with our detailed guide. Understand the importance of master data items, manage crop items and locations, and optimize demand and supply for each vintage.

In order to build out a Crop Supply Plan, and feed this from your Make Plan if required, there are master data items that need to be configured. Many of these are also used in other modules and so may already be set up, but here we will walk through what information is needed and how this informs the Crop Supply Plan.

### Core Data

The very first set of data that needs to be set up is the Crop Item Hierarchy. This is built using a Raw Material Item Hierarchy. (via the Item Hierarchy page - see [Item Hierarchy](https://github.com/zamapps/claret-docs/blob/main/farm/crop-supply-planning/item-hierarchy.md) documentation for more details). A default hierarchy has been created for you so you can update this or create a new one as you wish.

<figure><img src="/files/qBJIgK4eWrMyhPqaDxfM" alt="Default Crop Item Hierarchy"><figcaption></figcaption></figure>

Items are then added to this Hierarchy via the Items page. (Select the correct Hierarchy at the top). See [Crop Items](https://github.com/zamapps/claret-docs/blob/main/farm/crop-supply-planning/crop-items.md) for more details.

<figure><img src="/files/YZRwWAA0GyHD5bNkcON3" alt=""><figcaption></figcaption></figure>

Item\@Location links are then needed to connect the crop items to the locations they are sourced from. This is done on the Item\@Locations page. See [Item @ Locations](https://github.com/zamapps/claret-docs/blob/main/farm/crop-supply-planning/item-locations.md) for fruther details.

To build out the Crop Supply Plan, additional Master Data setup is required.

{% hint style="info" %}
Note: In the links below, change `<TENANT>` to the name of your tenant. For example, if the tenant is "zymoeno": `https://plan.claret.app/zymoeno`
{% endhint %}

<table><thead><tr><th width="118">Category</th><th width="105">Data</th><th width="452">Master Data Required</th><th>Notes</th></tr></thead><tbody><tr><td>Dependent Demand</td><td>Planned</td><td><ul><li>WIP Items set up - https://plan.claret.app/&#x3C;TENANT>/settings/master-data/hierarchy/item</li><li>Crop Items set up - https://plan.claret.app/&#x3C;TENANT>/settings/master-data/hierarchy/item</li><li>Recipes set up linking WIP items to Crop items - https://plan.claret.app/&#x3C;TENANT>/settings/master-data/recipes</li><li>Supply Plans with WIP make volumes - https://plan.claret.app/&#x3C;TENANT>/settings/transactional/supply-plans</li></ul></td><td>Crop Dependent Demand is calculated by looking at the planned WIP Make volumes and applying the recipe ratios to determine how much of each crop item 'ingredient' is required.</td></tr><tr><td>Supply</td><td>Planned</td><td><ul><li>Crop Items set up - https://plan.claret.app/&#x3C;TENANT>/settings/master-data/hierarchy/item</li><li>Crop Locations set up - https://plan.claret.app/&#x3C;TENANT>/settings/master-data/crop-locations</li><li>Supply Type for Crop Supply Plans - https://plan.claret.app/&#x3C;TENANT>/settings/master-data/supply-types</li></ul></td><td>Planned supply is the intended harvest volume for each crop location by vintage. This can be updated in the Crop Supply Planning view.</td></tr></tbody></table>


# Make Planning

Master the art of vintage make planning with Claret's comprehensive guide.  Learn how to manage sales data, inventory, and ideal release dates for a seamless planning experience.

Managing vintage supply and demand is hard. It’s a problem many other industries don’t face. Claret has a whole module designed to help you plan how much to make of a certain vintage, or how much you’ll need to make to meet your ideal releases across your vintages. This module is called 'Make Planning'.

The Make Planning module is designed to bring together, into one place, your

* Historical Sales Data for existing and previous vintages
* Forecast Sales Data, mapped to vintage release dates
* Inventory (Finished Good and Work in Progress)

And then to use this information to suggest an Ideal Vintage Make to meet your ideal release dates.

We know the ideal make isn't always possible though, so you can also manage your Planned Vintage Make and see how this impacts ideal release dates.

{% hint style="info" %}
For the Make Planning module to work correctly there will need to be some Master Data set up. For details please visit [Make Planning Setup](/make/make-planning/make-planning-setup)
{% endhint %}

### **Viewing the Make Plan**

To access the Make Planning module, go to the Make module and select 'Make Planning'

<figure><img src="/files/lyKzBPIt9EYnLmlOKdKa" alt=""><figcaption></figcaption></figure>

The main 'Make Planning' page is where the magic happens.

Select the Parent WIP Item (work in progress item) you would like to work with from the 'Parent WIP' selector. You can select one, or many, WIPs to display at a time.

<figure><img src="/files/HKJV1QvM8sSPs4f8FzQx" alt=""><figcaption></figcaption></figure>

The Make Planning Grid and Chart will then display.

{% hint style="info" %}
There are Grid and Chart views that you can use to see and visualise the plans and timelines. Use the Grid and Chart toggles to turn each one on and off.

<img src="/files/u11asJqPBeheH7VSQF0i" alt="" data-size="original">
{% endhint %}

<figure><img src="/files/T08vhHd4qJAJjhbziVnt" alt=""><figcaption></figcaption></figure>

The data used in each section (and used to build the chart) will depend on your view configuration. To set this up, select the view menu in the top right of your screen

<figure><img src="/files/i3TqqSUwJh8CK39HHbIm" alt=""><figcaption></figcaption></figure>

The view configuration screen then lets you set the data to use in the view.

<figure><img src="/files/uOCXG98mldTUuW1ISX5B" alt=""><figcaption></figcaption></figure>

Options are required for:

* Hierarchy Type - The WIP item hierarchy you wish to work with
* Supply Type - The supply plan used to read from and update the planned supply
* UOM - The Unit of Measure the data will be displayed in
* Sale Type to use for Sales Forecast - The sales type from which data will be pulled to calculate sales forecast for the child WIP
* Sale Type to use for Sales History - The sales type from which data will be pulled to calculate sales history for the child WIP

### The Make Planning Grid

We'll start with looking at the Make Planning grid. The grid displays the summary data for each Child WIP and the overall Make Plan (and is used to build the corresponding Gantt chart).

{% hint style="info" %}
The relationship between Parent and Child WIPs are set on the [Items](/master-data/items) page within the WIP-Aged Hierarchy types
{% endhint %}

#### Child Item Master Data

The first set of columns relate to settings on the child WIP item.

<figure><img src="/files/EowVUkmhyNSjayoHYtwu" alt=""><figcaption></figcaption></figure>

1. Vintage - This is a setting on the item and indicates which Vintage the Child WIP belongs to
2. Age Start Date - This is also a setting on the item and indicates the start date for ageing the item
3. Age - This is the sum of the routing steps set in the routing against the item. A Child item will have a default routing set against it, and the age is calculated by looking at total time for each step in the ageing process.

For example ZAMNVCAS15 is vintage 2015, and will start aging on 1 Jan 2016. The routing set against ZAMNVCAS15 in the item settings is 'High grade Cabernet Sauv'. This routing is set as 3 months barrel age and 3 months bottle age to give a total age of 6 months. So the ideal release date of ZAMNVCAS15 will be 6 months after the age start of 1 Jan 2016 - being 1 Jul 2016. This can be seen in the Ideal Release Date column further along in the gird. (See below)

{% hint style="info" %}
To update vintage and routing details, go to the. WIP Aged Hierarchy type on the [Items](/master-data/items) page and edit the items you wish to change.
{% endhint %}

#### Sales

Sales data used to determine the Make figures can be seen in the 'Sales columns.

<figure><img src="/files/ZojRsduMF51r2ImNiZW3" alt=""><figcaption></figcaption></figure>

1. Sales - History - Sales History for a Child WIP is determined by looking at all the items which include the WIP in their recipe. For example - if finished good item 123SVC15 contains ZAMNVCAS15 as part of it's recipe, then sales of 123SVC15 will be included in the Sales History for ZAMNVCAS15.
2. Sales - Forecast - As sales forecasting is generally done at the non-vintage level, any forecast Sales for the Parent WIP are apportioned across vintages based on the forecast ‘sell-date’. A forecast sale will be dynamically attributed to a vintage child WIP item if it is between the Ideal Release Date of the WIP item, and the Ideal Release date of the next WIP item.

Details of the historical and forecast sales making up the total against each WIP can be seen by clicking on the 'Total' value (highlighted in blue).

<figure><img src="/files/NXa1hOcFo13VVgukB2FR" alt=""><figcaption></figcaption></figure>

This shows, by month, the total sales (history and/or forecast) for each child WIP.

#### Inventory

<figure><img src="/files/yec3f6QWKKuTLMYWnwoH" alt=""><figcaption></figcaption></figure>

Both 'Work in Progress' (WIP) inventory and Finished Goods inventory is taken into consideration in Make Planning.

1. Work in Progress figures are determined by adding together all the inventory of the child WIP (at all locations) with a status of 'active-WIP'
2. Finished Goods inventory is included for all finished goods items (at all locations) that contain the child WIP in their recipe.

To see a breakdown of Inventory visit the 'Inventory' page

<figure><img src="/files/mchQotAphqQWxNqHqnNK" alt=""><figcaption></figcaption></figure>

#### Supply Plan

This is where the magic happens.

We can use the sales and inventory data both for this vintage, and previous vintages, to recommend an ideal make figure for each vintage.

<figure><img src="/files/t5yRv8XvylFM3sLb5nTL" alt=""><figcaption></figcaption></figure>

This is the volume that will allow you to meet forecast demand, and run the vintage down perfectly to the ideal release of the next vintage. This is the number which, in a perfectly planned world, would see us meet the last month of demand exactly, and then release the next vintage exactly when planned (with no inventory remaining of the previous vintage).

This may not be how much the winemakers actually plan to make though, so let's start by looking at the 'Planned' supply plan/make.

This figure is read from the Supply Plan selected in the view configuration (see[ Viewing the Make Plan ](#viewing-the-make-plan)) and is the total of all planned make for that child WIP. You can update this here in the Make Planning screen, and this will then update back into the Supply Plan.

This 'Planned' make figure then drives the next set of information.

<figure><img src="/files/PE1HsaFxwgY7N9smEaRr" alt=""><figcaption></figcaption></figure>

**Overall Position**

All of our inputs now allow us to determine what will happen to the release dates if the 'Supply Plan' make figure is produced, rather than the 'Ideal Make'.

<figure><img src="/files/XkORFU4sD0mEA0uUHwdV" alt=""><figcaption></figcaption></figure>

1. Surplus - This is how much under/over supply you will have if you sell all of the 'Planned' make volume as it stands. So, if you plan to make 100,000 gallons, but you already have 10,000 gallons in inventory, then if you sell 100,000 gallons, you will be left with 10,000 gallons surplus.
2. Packed - This is the volume already packed for sale - and is equal to total finished goods inventory plus any sales history.
3. To Pack - This is the volume left to pack - and is equal to the Planned supply figure less the 'Packed' amount (ie how much you plan to make less how much you've already packed).
4. Position - This is a key one. This is the volume you are likely to have remaining, based on current forecast sales, when the next vintage is due to be released.

{% hint style="info" %}
If the 'Position' is a positive number, you're going to have volume left over at the current planned end of the vintage (and hence will flow into the timeline for the next vintage)

If the Position is a negative number, you're going to run out of this Vintage before the next Vintage is currently planned to be released.
{% endhint %}

The Release Date' data then shows us the impact on our release dates with our current 'Planned' make.

1. Ideal - simply the Age Start Date for the child WIP, plus the Age (as set in the routing)
2. Planned - the date the vintage will be released to meet forecast demand, based on the current planned supply. (And is determined by adding the MPIR value to the Ideal Release Date.
3. MPIR - the number of months of demand covered by the 'Position'. So if the position is calculated as 2107 gallons, and the forecast demand for the months following the ideal end of the vintage is 1000 gallons per month, then this vintage will go 2.1 months past the ideal release of the next vintage (ie the MPIR value will be 2.1).

{% hint style="info" %}
Hovering over the 'i' icon on a column header shows further details on how the data in the column is calculated
{% endhint %}

### The Make Planning Gantt Chart

The Make Planning Gantt Chart is a visual representation of the overall position for each Child WIP. It depicts the release end date if the 'Planned' supply figure is produced, and shows if this overlaps, or falls short of, the planned release for the next Child WIP.

Each Child WIP has a Gantt bar which shows its release period as follows:

* Start Date - The **Ideal** Release Date
* End Date - The next vintage **Ideal** Release Date + Months Past Ideal Release of this vintage. ie, how much longer (or shorter if the MPIR is negative) will this vintage spill over into the ideal timing for the next vintage.

<figure><img src="/files/1PXIQoZz2B3GQb7oNwhY" alt=""><figcaption></figcaption></figure>

{% hint style="info" %}
The grid and chart columns displayed in the Make Planning View can be configured by hovering over any column header, and then clicking on the three bars that appear to bring up the column selector.

<img src="/files/RLTw7pGe2OCyD5rH4a9y" alt="" data-size="original"><img src="/files/7bmqQjAQDr4ZwQ1aaZui" alt="" data-size="original">
{% endhint %}


# Quick Start: Make Planning

Quick start guide for Make Planning — how to select a WIP item, read the grid (sales, inventory, supply plan, position), and understand the Gantt chart.

## What You'll Learn

Make Planning helps you plan how much to make of each vintage by bringing together sales data, forecast data, and inventory into one view. After this guide, you'll be able to navigate to the module, select WIP items, read the planning grid, and interpret the Gantt chart.

## Before You Begin

Your admin should have already:

* Set up WIP (Work in Process) Items and Finished Goods Items
* Configured Routings and Recipes linking WIP items to finished goods
* Imported sales data and inventory data
* Created at least one view configuration

If the module shows no data, check with your admin that setup is complete. See [Setting Up Make Planning](/using-claret/getting-started/setting-up-modules/setting-up-make-planning) for what's required.

## Step 1: Access Make Planning

Navigate to **Make > Make Planning** in the left navigation menu.

<figure><img src="/files/lyKzBPIt9EYnLmlOKdKa" alt=""><figcaption><p>The Make Planning menu item in the navigation</p></figcaption></figure>

## Step 2: Select a View

1. Click the **view menu** in the top-right of the page
2. Select a workspace view or configure a personal view
3. The view determines which sales data, inventory data, and supply plan data is displayed

<figure><img src="/files/uOCXG98mldTUuW1ISX5B" alt=""><figcaption><p>The Make Planning view configuration screen</p></figcaption></figure>

## Step 3: Select WIP Items

1. Use the **Parent WIP selector** at the top of the page. (You can use the filters to filter down the options in the Parent WIP selector.)
2. Select one or more WIP items to display
3. The grid and chart will populate with data for the selected items

Each WIP item expands to show its child items (vintages), so you can see the breakdown by vintage year.

<figure><img src="/files/HKJV1QvM8sSPs4f8FzQx" alt=""><figcaption><p>The Parent WIP selector at the top of the Make Planning page</p></figcaption></figure>

## Step 4: Read the Grid

The Make Planning grid is organized into sections:

| Section                    | What It Shows                                                                       |
| -------------------------- | ----------------------------------------------------------------------------------- |
| **Child Item Master Data** | Vintage, age start date, and age for each child item                                |
| **Inventory**              | Current finished goods and WIP inventory levels                                     |
| **Sales (History)**        | Historical sales volumes for each vintage                                           |
| **Sales (Forecast)**       | Forecasted sales mapped to vintage release dates                                    |
| **Supply Plan**            | Ideal make (calculated) and planned make (your plan) quantities                     |
| **Overall Position**       | Surplus/deficit, packed quantities, to-pack quantities, position, and release dates |

<figure><img src="/files/T08vhHd4qJAJjhbziVnt" alt=""><figcaption><p>The Make Planning grid, with columns grouped by section</p></figcaption></figure>

{% hint style="info" %}
The **Ideal Make** is calculated by Claret based on demand and inventory. The **Planned Make** is what you actually plan to produce — you can edit this value if it differs from the ideal.
{% endhint %}

## Step 5: Understand the Gantt Chart

Toggle the **Chart** view on using the Grid/Chart toggles at the top of the page. The Gantt chart provides a visual timeline showing:

* When each vintage is expected to be released
* How long the vintage is expected to available for (based on make and demand)
* Overlap between vintages based on current plans

Use the Gantt chart alongside the grid to visualize your production schedule and spot timing conflicts.

<figure><img src="/files/1PXIQoZz2B3GQb7oNwhY" alt=""><figcaption><p>The Make Planning Gantt chart showing vintage release timelines</p></figcaption></figure>

## Understanding the Data

Key metrics in Make Planning:

| Metric           | What It Means                                                                                                         |
| ---------------- | --------------------------------------------------------------------------------------------------------------------- |
| **Ideal Make**   | The quantity Claret recommends producing to meet demand given current inventory                                       |
| **Planned Make** | The quantity you actually plan to produce — edit this to reflect your production plan                                 |
| **Position**     | The net position after accounting for demand, inventory, and planned production. Negative means a potential shortfall |
| **Surplus**      | Inventory that exceeds demand requirements                                                                            |

## Common Questions

### How does demand flow into Make Planning?

Make Planning pulls demand from sales data (history and forecasts) configured in the view. Recipes link finished goods items to WIP items, so demand for a finished good translates into demand for its component WIP item.

### Can I edit the planned make quantity?

Yes, if your license allows. Click on the Planned Make cell for a vintage and enter your planned production quantity. If you cannot edit Planned Make, contact your administrator to check your permissions.

### What do the vintage release dates mean?

Release dates indicate when a vintage is planned to transition from WIP to finished goods and be available to meet demand. The Ideal Make calculation considers these dates when determining how much to produce and when.


# Make Planning Setup

Set up your Make Plan in Claret with our detailed guide. Understand the importance of master data items, manage sales history and forecast, and optimize inventory across locations.

In order to build out a Make Plan and feed this into a Crop Supply Plan, there are master data items that need to be configured. Many of these are also used in other modules and so may already be set up, but here we will walk through what information is needed and how this informs the Make Plan.

### Core Data

The very first set of data that needs to be set up is the Parent and Child WIP Hierarchy. This is built using a Work In Process - aged Item Hierarchy. (via the Item Hierarchy page).

<figure><img src="/files/we0IZFLIe0BmmP6lvH05" alt=""><figcaption></figcaption></figure>

Items are then added to this Hierarchy via the Items page. (Select the correct Hierarchy at the top)

<figure><img src="/files/nx9S4mw4jIckydCVScht" alt=""><figcaption></figcaption></figure>

The Current Vintage for the Parent is set against the Parent Item

<figure><img src="/files/nx9S4mw4jIckydCVScht" alt=""><figcaption></figcaption></figure>

Each Child WIP then has a Routing, Age Start and Vintage defined.

<figure><img src="/files/ROGjRYw5tQJKu5x9AepY" alt=""><figcaption></figcaption></figure>

To then build out the Make Plan, additional Master Data setup is required.

{% hint style="info" %}
Note: In the links below, change `<TENANT>` to the name of your tenant. In this example, the tenant is "zymoeno": `https://plan.claret.app/zymoeno`
{% endhint %}

<table><thead><tr><th width="118">Category</th><th width="105">Data</th><th width="452">Master Data Required</th><th>Notes</th></tr></thead><tbody><tr><td>Sales</td><td>History</td><td><ul><li>Sales-level Items set up - https://plan.claret.app/&#x3C;TENANT>/settings/master-data/hierarchy/item</li><li>Item@Customer Groups set up - https://plan.claret.app/&#x3C;TENANT>/settings/master-data/item-customer-group</li><li>Recipes set up - https://plan.claret.app/&#x3C;TENANT>/settings/master-data/recipes</li></ul></td><td>Only Sales up to the 'Forecast Start Date' set in https://plan.claret.app/&#x3C;TENANT>/settings/application-maintenance/settings are included.</td></tr><tr><td>Sales</td><td>Forecast</td><td><p>SALES (FORECAST DEMAND) LEVEL ITEMS</p><ul><li>Forecast-level (non-vintage) Items set up - https://plan.claret.app/&#x3C;TENANT>/settings/master-data/hierarchy/item</li><li>Item@Customer Groups set up - https://plan.claret.app/&#x3C;TENANT>/settings/master-data/item-customer-group</li></ul><p>SUPPLY ITEMS</p><ul><li>Item@Locations set up for Parent WIP item - https://plan.claret.app/&#x3C;TENANT>/settings/master-data/item-location</li><li>Supply and Demand Map set up between Parent WIP (Supply) Item and Parent Sales (Forecast Demand) Item - https://plan.claret.app/&#x3C;TENANT>/settings/master-data/supply-and-demand-map</li></ul></td><td>Forecast Sales at the non-vintage level are apportioned across vintages based on the 'sell-date'. A forecast sale will be dynamically attributed to a vintage child WIP item if it is between the Ideal Release Date of the WIP item and the Ideal Release date of the next WIP item.</td></tr><tr><td>Inventory</td><td>WIP</td><td><ul><li>Item@Locations set up for child WIP item - https://plan.claret.app/&#x3C;TENANT>/settings/master-data/item-location</li><li>Inventory added - https://plan.claret.app/&#x3C;TENANT>/settings/transactional/inventory</li></ul></td><td>Inventory will be the sum of all WIP inventory across locations</td></tr><tr><td>Inventory</td><td>Finished Goods</td><td><ul><li>Item@Locations set up for Finished Good, vintaged, items - https://plan.claret.app/&#x3C;TENANT>/settings/master-data/item-location</li><li>Inventory added - https://plan.claret.app/&#x3C;TENANT>/settings/transactional/inventory</li></ul></td><td>Inventory will be the sum of all Finished Good inventory across locations</td></tr></tbody></table>


# Inventory Workbench - Internal

Plan optimal production runs by analyzing current inventory levels, sales forecasts, and days on hand targets using the Inventory Workbench.

Balancing production schedules with fluctuating demand is a constant challenge. Produce too much and you tie up capital in excess inventory; produce too little and you risk stockouts and missed sales. Claret's Inventory Workbench - Internal is designed to help you find that balance.

The Inventory Workbench - Internal module brings together, in one place, your:

* Current inventory levels at each location
* Sales forecasts and historical demand
* Days on Hand (DOH) targets and safety stock requirements
* Supply plan recommendations

This allows you to see your inventory position across all items at a location, identify where you need to produce more (or less), and generate supply plans that maintain your target inventory levels while meeting expected demand.

{% hint style="info" %}
For the Inventory Workbench - Internal module to work correctly, there will need to be some Master Data set up. For details please visit [Inventory Workbench - Internal Setup](/pack/inventory-workbench-internal/inventory-workbench-internal-setup)
{% endhint %}

## Navigating to the Inventory Workbench

To access the Inventory Workbench - Internal module, go to the Pack module and select 'Inventory Workbench - Internal'.

## Creating a View

Before you can use the workbench, you must create a View that defines how data is displayed and calculated.

### Create a New View

1. Click on the View dropdown in the top-right corner of the page.
2. Click "Add View".
3. Enter a name for your View.
4. Configure the View settings (see below).
5. Click "Save".

<figure><img src="/files/1RB8iY0tcb7n8rmCgC1k" alt=""><figcaption></figcaption></figure>

The View configuration screen lets you set the data to use in the view.

Options are required for:

* **Item Hierarchy Type** - The item hierarchy you wish to work with
* **Unit of Measure** - The UOM for display and calculations
* **Time Settings** - Configure how time periods are displayed in the workbench:
  * **Time Period Type**: Choose between calendar-based periods (aligned to your fiscal calendar) or continuous periods (a configurable number of periods from the start date)
  * **Time Interval**: Select Days, Weeks, or Months to control the granularity of each column in the grid
  * **Start Date**: Set when the planning period begins
* **Choose Locations to include** (optional) - Select one or more locations to restrict which locations appear in the sidebar. Leave empty to show all available locations.

<figure><img src="/files/IzDzMwbP8Rzs0ww47D0J" alt=""><figcaption></figcaption></figure>

There are then 4 tabs where you will need to select options to configure your View\.7

### Demand Tab

The Demand tab is where you configure which sale types represent customer demand for production planning.

<figure><img src="/files/Z0TF8YpsSIMgJa9WmWAr" alt=""><figcaption></figcaption></figure>

| Field          | Description                                                                                                                                                      |
| -------------- | ---------------------------------------------------------------------------------------------------------------------------------------------------------------- |
| Sales Forecast | Select the sale type that contains your sales forecast data. This is used to project future demand and calculate production requirements.                        |
| Sales Orders   | Select the sale type that contains actual sales orders. This provides real order data that can be used alongside or instead of forecasts for near-term planning. |

The workbench uses this demand data to:

* Calculate how much inventory you need to meet expected sales
* Project when you will need to produce more
* Inform Days on Hand calculations

### Supply Tab

The Supply tab is where you configure the supply type used for production planning.

<figure><img src="/files/WJ0q6yXUbnqMbjED1soK" alt=""><figcaption></figcaption></figure>

| Field       | Description                                                                          |
| ----------- | ------------------------------------------------------------------------------------ |
| Supply Type | Select the supply type used for supply plans (e.g., "Production", "Planned Supply"). |

The workbench uses this supply data to:

* Display existing supply plans in the detail grid
* Store generated supply plan recommendations
* Calculate the impact of planned production on inventory levels

### Inventory Tab

The Inventory tab is where you configure Days on Hand calculations and display settings.

<figure><img src="/files/WJ0q6yXUbnqMbjED1soK" alt=""><figcaption></figcaption></figure>

| Field                    | Description                                                                                             |
| ------------------------ | ------------------------------------------------------------------------------------------------------- |
| Days on Hand Calculation | Choose whether to calculate DOH based on Beginning Inventory or Ending Inventory.                       |
| Conditional Formatting   | Configure visual indicators (e.g., highlight cells where DOH is greater than or less than a threshold). |

These settings control:

* How Days on Hand values are calculated in the detail grid
* Visual formatting to highlight items that need attention
* Time period alignment for planning calculations

### Charts Tab

The Charts tab allows you to configure up to 4 visualizations that appear in the detail view when you select an item.

<figure><img src="/files/lG45Tt1vBJbvL83qpjxr" alt=""><figcaption></figcaption></figure>

Available data options to chart include:

| Data to Chart | Description                                                                   |
| ------------- | ----------------------------------------------------------------------------- |
| Days on Hand  | Shows projected DOH over time based on current inventory and demand forecasts |
| Sales         | Displays historical and forecasted sales trends                               |
| Inventory     | Shows inventory level changes over time                                       |
| Supply Plans  | Displays planned production quantities                                        |

Charts provide a visual representation of the data in the detail grid, making it easier to identify trends and plan production timing.

## Using the Sidebar Filter

The sidebar filter is where you select which location and items to view in the workbench. Use the toggle button on the left edge of the screen to show or hide the sidebar filter.

### Sidebar Filter Toggle

A pill-shaped toggle button appears on the left edge of the workbench:

* When collapsed, it shows "Show filter"
* When expanded with selections made, it displays a summary (e.g., "5 items @ Main Warehouse")
* Click the toggle to expand or collapse the sidebar filter
* Your selections persist when you collapse and reopen the sidebar filter

<figure><img src="/files/6M20RgPbVELlxb8M6amc" alt=""><figcaption></figcaption></figure>

### Selecting Items and Location

You must select both a location and items to view data in the workbench.

1. Open the sidebar filter using the toggle button.
2. In the Location section, search or browse for your location and click to select it. If your View is configured with a **Choose Locations to include** filter, only those locations will be listed.
3. In the Items section, browse or search the item hierarchy tree:
   * Use checkboxes to select individual items
   * Click the cards icon beside a hierarchy level to automatically select all items underneath
   * The header shows how many items are selected (e.g., "Items (5 selected)")
4. Click "Apply" to confirm your selections and load the grid.

{% hint style="warning" %}
Only locations that have Item @ Location and Item @ Customer Group links (via the Supply and Demand Map) appear in the location list.
{% endhint %}

## The Inventory Workbench Grid

The main grid provides an at-a-glance view of Days on Hand across all items at the selected location. Each row represents an item, and the time period columns show DOH values calculated from the underlying demand forecasts, inventory levels, and supply plans.

{% hint style="warning" %}
Collapse the item and location filter for better viewing of the grid.
{% endhint %}

<figure><img src="/files/ePLIKww2UgrvXppBX9tM" alt=""><figcaption></figcaption></figure>

{% hint style="info" %}
The relationships between Items and Locations are set on the [Item @ Locations](/master-data/item-locations) page. A row will appear in the grid for every item that is linked to the selected location.
{% endhint %}

### Grid Columns

| Column              | Description                                                                          |
| ------------------- | ------------------------------------------------------------------------------------ |
| Item Hierarchy      | Item parents, item name and description based on your selected hierarchy             |
| Data                | Indicates what data element is showing (generally DOH - Days on Hand)                |
| Trend               | Sparkline chart showing DOH trend over time                                          |
| Time Period Columns | Days on Hand value for each period (month, week, or day based on your View settings) |

Days on Hand values are color-coded to highlight items needing attention:

* **Red** indicates DOH is below your configured threshold (potential stockout risk)
* **Indigo** indicates DOH is above your configured threshold (potential overstock)
* **∞** (infinity symbol) appears when DOH exceeds 365 days

{% hint style="info" %}
The main grid shows summarized DOH values. To see the underlying demand forecasts, inventory levels, and supply plan details, click on a row to open the detail view.
{% endhint %}

### Filtering the Grid

1. Hover over a column header to reveal the filter menu icon.
2. Click the menu icon to open the filter options for that column.
3. Enter filter criteria or select values to filter by.
4. The grid updates automatically to show only matching rows.

### Viewing Item Details

Click on any row in the grid to open the detail view showing comprehensive item information.

## Working with the Detail View

The detail view is where you analyze inventory and manage supply plans for a specific item at the location. Use it to:

* See how demand forecasts and supply plans affect inventory levels over time
* Identify when you need to produce more to avoid stockouts
* Edit supply plan quantities to adjust production schedules
* Run supply plan generation to get production recommendations

<figure><img src="/files/Ch6R5Z9Wz2H7p0JBzufv" alt=""><figcaption></figcaption></figure>

The detail view contains:

* **Header** - Shows item name, description, and location
* **Detail Grid** - Hierarchical tree view showing demand, supply, and DOH data by time period
* **Charts** - Up to 4 visualizations based on your View configuration
* **Action Buttons** - Run supply plan and configure planning parameters

### Detail Grid Structure

The detail grid displays data in a tree structure with the following rows:

| Row                 | Description                                                                                                                                                               |
| ------------------- | ------------------------------------------------------------------------------------------------------------------------------------------------------------------------- |
| Beginning Inventory | Starting inventory for each period. For the first period, this is the actual current inventory. For subsequent periods, it equals the previous period's ending inventory. |
| Demand              | Parent row containing sales forecast data. Expand to see Forecast and History sub-rows.                                                                                   |
| Supply              | Parent row containing supply plan data. Expand to see existing and planned production.                                                                                    |
| Ending Inventory    | Closing inventory for each period.                                                                                                                                        |
| Days on Hand        | How many days the ending inventory will last based on forecasted demand.                                                                                                  |

### How Calculations Work

**Ending Inventory** is calculated for each period as:

```
Ending Inventory = Beginning Inventory - Demand + Supply
```

**Days on Hand** looks forward from each period to determine how long the inventory will last:

1. Starting with the ending inventory for the period
2. Subtracting forecasted demand from each future period
3. Counting days until inventory runs out
4. If inventory covers all visible periods, DOH shows as **∞** (infinity)

{% hint style="info" %}
The DOH calculation uses forecasted demand to project how quickly you will sell through inventory. Higher DOH means more runway; lower DOH indicates production is needed soon.
{% endhint %}

### Editing Supply Plan Values

Supply plan values in the detail grid appear as clickable links. Clicking a supply value opens a popover where you can manage individual supply plan records.

1. Click on a supply plan value in the "Firmed" or "Planned" row (values at or after the plan start date).
2. A popover opens showing the individual supply plan records that make up the total.
3. In the popover, you can:
   * Edit quantities for existing supply plans
   * Change dates or status
   * Add new supply plan records
   * Delete existing records

<figure><img src="/files/d6FVu9JqIjNc7dmhAxC6" alt=""><figcaption></figcaption></figure>

{% hint style="warning" %}
Supply plans with dates earlier than the plan start date display a warning icon. These are considered "past due" and will be rolled into the plan start period for calculations.
{% endhint %}

When you edit supply values:

* Changes are saved immediately when you close the popover
* Ending inventory recalculates for that period and all future periods
* Days on Hand recalculates to reflect the updated inventory projection

{% hint style="info" %}
Only "Firmed" and "Planned" supply rows show as clickable links. "Scheduled" supply values are read-only. Supply plan editing is only available for periods at or after the plan start date.
{% endhint %}

## Configuring Planning Parameters

Planning parameters control how supply plans are generated for each item at a location. These can be configured at the item level to fine-tune supply plan recommendations.

### Open Planning Parameters

1. Open the detail view for an item.
2. Click the Settings (tune) button in the header.
3. A sidebar opens with planning parameter options.

<figure><img src="/files/naNXZOct0Va36e0TD8A9" alt=""><figcaption></figcaption></figure>

### Planning Parameter Options

The planning parameters are organized into sections:

**Plan Start and Lock**

| Parameter          | Description                                      |
| ------------------ | ------------------------------------------------ |
| Plan Start Date    | When to begin supply planning                    |
| Plan Duration Days | How far forward to plan                          |
| Lock Duration Days | Period during which quantities cannot be changed |
| Lock End Date      | When the lock expires                            |

**Cycle Stock**

| Parameter        | Description                                 |
| ---------------- | ------------------------------------------- |
| Coverage Days    | Target days of inventory to maintain        |
| Minimum Quantity | Minimum production quantity per supply plan |

**Safety Stock**

| Parameter                  | Description                                             |
| -------------------------- | ------------------------------------------------------- |
| Safety Stock Coverage Days | Additional days of inventory to hold as a safety buffer |
| Safety Stock Quantity      | Fixed quantity to maintain as a safety buffer           |

**Forecast Adjustment**

| Parameter                  | Description                         |
| -------------------------- | ----------------------------------- |
| Net Demand Option          | Strategy for calculating net demand |
| Ignore Sales Forecast Days | Skip forecast data within N days    |

**Other**

| Parameter    | Description                                                 |
| ------------ | ----------------------------------------------------------- |
| Is Plannable | Unchecking will mean plans will not be created for the item |

## Running Supply Plans

This is where the planning happens. The Internal workbench can automatically generate supply plan recommendations based on your demand forecasts, current inventory, and planning parameters.

The supply plan algorithm:

* Looks at forecasted demand for each future period
* Considers current inventory levels
* Applies your planning parameters (coverage days, safety stock, etc.)
* Generates production quantities needed to maintain target Days on Hand

### Run Supply Plan for a Single Item

1. Open the detail view for the item.
2. Click the Play button in the header.
3. The supply plan is generated and displayed in the Supply row of the detail grid.

The generated supply plan values are saved immediately and can be further edited if needed.

### Run Supply Plan for All Items

To generate supply plans for all items at the selected location:

1. Click the "Run supply plan for all" button in the toolbar.
2. A confirmation modal appears showing the number of items to process.
3. Click "Confirm" to start the job.
4. The job runs in the background. Click the Job ID link to monitor progress.

<figure><img src="/files/9bG4bnCSy4vE1ayNczsj" alt=""><figcaption></figcaption></figure>

{% hint style="info" %}
When the job completes, the grid updates automatically. Any items that were skipped (due to missing configuration) are listed in the warning message.
{% endhint %}

### How Supply Plans Are Generated

The supply plan generation uses your planning parameters to determine when and how much to produce:

1. **Plan Start Date** - Production recommendations start from this date
2. **Coverage Days** - Target days of inventory to maintain
3. **Safety Stock** - Minimum inventory buffer to keep on hand
4. **Demand Forecast** - Expected sales that need to be covered

The algorithm calculates the production needed in each period to maintain your target coverage while accounting for expected demand.

{% hint style="warning" %}
Supply plan generation requires planning parameters to be configured for each item. Items without planning parameters will be skipped during batch processing.
{% endhint %}

## Empty States

If you see an empty state message, follow these steps to resolve it:

| Message                | Resolution                                                                     |
| ---------------------- | ------------------------------------------------------------------------------ |
| No View configured     | Create a View using the View dropdown                                          |
| No Supply/Demand links | Configure links in [Supply and Demand Map](/master-data/supply-and-demand-map) |
| No Location selected   | Select a location from the dropdown                                            |
| Location has no links  | Configure Item @ Location and Item @ Customer Group links for this location    |


# Quick Start: Inventory Workbench - Internal

Quick start guide for Inventory Workbench - Internal — how to create a view, select a location, read the DOH grid, edit supply plans, run supply plan generation, and configure planning parameters.

## What You'll Learn

Inventory Workbench - Internal helps you balance inventory at your own (internal) locations by tracking demand, supply plans, and days on hand (DOH). After this guide, you'll be able to navigate to the module, select or create a view, understand the grid, edit supply plan values, and run supply plan generation.

## Before You Begin

Your admin should have already:

* Set up Items, Locations, and Item @ Locations
* Configured Customer Groups and Item @ Customer Groups
* Set up the Supply and Demand Map for internal inventory
* Configured Sale Types and Supply Types

If the module page is empty, check with your admin that the setup is complete. See [Setting Up Inventory Workbench - Internal](/using-claret/getting-started/setting-up-modules/setting-up-inventory-workbench-internal) for what's required.

## Step 1: Access Inventory Workbench - Internal

Navigate to **Pack > Inventory Workbench - Internal** in the left navigation menu.

<figure><img src="/files/hF0dtshLKwolLhfsZfA0" alt=""><figcaption><p>[Navigating to Inventory Workbench - Internal]</p></figcaption></figure>

## Step 2: Create or Select a View

1. Click the **view button** in the top-right of the page
2. Select an existing **workspace view** if one is available
3. To create a new view, click **Configure** then **Add**:
   * Give the view a name
   * Select the **Demand** tab to configure which sale types represent demand data
   * Select the **Supply** tab to configure which supply types to include
   * Select the **Inventory** tab to configure inventory data sources
   * Optionally, configure the **Charts** tab for visual analysis

<figure><img src="/files/1RB8iY0tcb7n8rmCgC1k" alt=""><figcaption><p>The Inventory Workbench - Internal view configuration screen</p></figcaption></figure>

For more details on how to create a view in Inventory Workbench - Internal, see [Creating a View in Inventory Workbench - Internal](/pack/inventory-workbench-internal) for what's required.

## Step 3: Use the Sidebar to Filter Data

1. Toggle the **sidebar** open using the sidebar button
2. Select a **location** from the location list
3. Select one or more **items** from the item picker (or use Select All)
4. Click **Apply** to load data for your selection

The grid will populate with inventory data for the selected items at the chosen location.

<figure><img src="/files/6M20RgPbVELlxb8M6amc" alt=""><figcaption><p>The sidebar with the location and item picker</p></figcaption></figure>

## Step 4: Read the Grid

The main grid shows a summary row for each item:

| Column        | What It Shows                                                                  |
| ------------- | ------------------------------------------------------------------------------ |
| **Item**      | The product name                                                               |
| **DOH**       | Days of Hand — how many days of inventory remain based on current demand rates |
| **Demand**    | Total demand for the selected time period                                      |
| **Supply**    | Total planned supply for the selected time period                              |
| **Inventory** | Current inventory level at the location                                        |

Items are color-coded based on their DOH status to help you quickly spot items that need attention.

<figure><img src="/files/ePLIKww2UgrvXppBX9tM" alt=""><figcaption><p>The main grid showing summary rows with DOH, Demand, Supply, and Inventory</p></figcaption></figure>

## Step 5: Work with the Detail View

Click on an item row to open the **detail view**, which breaks data down by time period:

| Row            | What It Shows                                                    |
| -------------- | ---------------------------------------------------------------- |
| **Demand**     | Sales forecast and historical demand by period                   |
| **Supply**     | Planned supply by period                                         |
| **Production** | Production quantities by period (included in the Supply heading) |
| **Inventory**  | Opening and closing inventory by period                          |
| **DOH**        | Calculated days of hand for each period                          |

This time-period view helps you identify when inventory levels will drop below acceptable thresholds.

<figure><img src="/files/Ch6R5Z9Wz2H7p0JBzufv" alt=""><figcaption><p>The detail view for an item, showing demand, supply, production, inventory, and DOH by period</p></figcaption></figure>

## Step 6: Edit Supply Plan Values

To adjust supply plans:

1. Open the **detail view** for an item
2. Click on a cell in an **editable supply row**. (Identified via blue text)
3. A 'Supply Plans' modal appears showing existing supply plans. Edit or add supply plans here.
4. The DOH and inventory calculations update automatically

<figure><img src="/files/d6FVu9JqIjNc7dmhAxC6" alt=""><figcaption><p>Editing a supply plan value using the edit popover</p></figcaption></figure>

## Step 7: Run Supply Plan Generation (Optional)

Claret can automatically generate supply plans based on your planning parameters:

1. To generate for a **single item** — use the action menu on the item row in the detail view
2. To generate for **all items** — use the toolbar action to run supply plan generation across all items in the current view (on the main view)

<figure><img src="/files/9bG4bnCSy4vE1ayNczsj" alt=""><figcaption><p>Running supply plan generation for a single item from the action menu</p></figcaption></figure>

{% hint style="info" %}
Supply plan generation uses the planning parameters configured for each item (cycle stock, safety stock, forecast adjustments, etc.). See the [Inventory Workbench - Internal](/pack/inventory-workbench-internal) documentation for details on configuring planning parameters.
{% endhint %}

## Understanding the Data

**Days on Hand (DOH)** is the key metric. It tells you how many days the current inventory will last based on demand. The module color-codes items based on DOH thresholds to highlight items needing attention.

**Supply plan generation** calculates recommended supply quantities based on:

* Current and projected inventory levels
* Demand forecasts
* Planning parameters (cycle stock targets, safety stock, plan lock periods)

## Common Questions

### What's the difference between Internal and Partner?

Inventory Workbench - Internal tracks inventory at your own locations using supply plans and production data. Inventory Workbench - Partner tracks inventory at distributor locations using depletion and shipment data. See [Inventory Workbench - Partner](/sell/inventory-workbench-partner) for the partner module.

### How do I configure planning parameters?

Planning parameters (cycle stock, safety stock, forecast adjustment, plan start and lock) are configured per item. See the [Inventory Workbench - Internal](/pack/inventory-workbench-internal) documentation for the full list of parameters and how to configure them.

### What does supply plan generation actually do?

It calculates how much supply is needed in each period to maintain your target inventory levels (based on cycle stock and safety stock settings) while meeting forecast demand. The generated values appear in the supply plan rows and can be adjusted manually.


# Inventory Workbench - Internal Setup

Set up Inventory Workbench - Internal in Claret with our detailed guide. Understand the master data requirements and configure your items, locations, and supply/demand mappings.

In order to use the Inventory Workbench - Internal and generate supply plan recommendations, there are master data items that need to be configured. Many of these are also used in other modules and so may already be set up, but here we will walk through what information is needed and how this informs the Inventory Workbench.

## Core Data

The foundation of the Internal Workbench is built on three key elements, and the relationships between them:

1. **Items** - The products you produce and store
2. **Locations** - Your production and storage locations (where inventory is held)
3. **Customer Groups** - Who buys those items (to drive demand forecasts)

These are connected through Item @ Locations, Item @ Customer Groups, and the Supply and Demand Map.

The following steps take you through each set of data required to get Inventory Workbench - Internal up and running.

<figure><img src="/files/IlCEMlqQ7RpDZ0GMa2ri" alt=""><figcaption></figcaption></figure>

## Master Data Requirements

Follow these steps to configure the master data required for Inventory Workbench - Internal.

### Step 1: Set Up Your Item Hierarchy

1. Go to Settings > Master Data > [Item Hierarchy](/master-data/item-hierarchy).
2. Create or select a Finished Goods Item Hierarchy.
3. Go to Settings > Master Data > [Items](/master-data/items).
4. Add items to the hierarchy.

{% hint style="info" %}
The Item Hierarchy Type you select in your View configuration determines which items appear in the workbench.
{% endhint %}

### Step 2: Set Up Your Inventory Locations

Create locations representing where you produce and store inventory. These are the locations you will select in the workbench dropdown.

1. Go to Settings > Master Data > [Location Maintenance](/master-data/location-maintenance).
2. Create locations for each production or storage point (e.g., "Main Warehouse", "Production Facility A").

{% hint style="info" %}
Inventory locations represent your internal production and storage facilities, not partner or customer locations.
{% endhint %}

### Step 3: Link Items to Locations

Create Item @ Location links for each item stored or produced at each location.

1. Go to Settings > Master Data > [Item @ Locations](/master-data/item-locations).
2. Create links between items and the locations where they are stored or produced.

{% hint style="info" %}
Only locations with Item @ Location links will appear in the workbench dropdown.
{% endhint %}

### Step 4: Set Up Your Customer Group Hierarchy and Customer Groups

Customer Groups represent who buys your products. Their demand forecasts drive your production planning.

1. Go to Settings > Master Data > [Customer Group Hierarchy](/master-data/customer-group-hierarchy).
2. Create or finalise a Customer Group Hierarchy.
3. Go to Settings > Master Data > [Customer Groups](/master-data/customer-groups).
4. Create customer groups representing your customers or market segments.

### Step 5: Link Items to Customer Groups

Item @ Customer Group links define which customers buy which items. This is the demand side of the planning equation.

1. Go to Settings > Master Data > [Item @ Customer Groups](/master-data/item-customer-groups).
2. Create links between items and the customer groups that buy them.

{% hint style="info" %}
Demand forecasts are stored against Item @ Customer Group combinations. The workbench aggregates demand for an item across all customer groups mapped to the selected location.
{% endhint %}

### Step 6: Configure the Supply and Demand Map

The Supply and Demand Map connects Item @ Customer Groups (demand) to Item @ Locations (supply). This tells the workbench which customer group demand data to use for each item at a location.

1. Go to Settings > Master Data > [Supply and Demand Map](/master-data/supply-and-demand-map).
2. For each item, create mappings that link the Item @ Customer Group to the Item @ Location.

For example, if "Chardonnay" is sold to customer group "West Coast Retailers" and produced at "Main Winery", create a Supply and Demand Map entry linking the Chardonnay @ West Coast Retailers to Chardonnay @ Main Winery.

{% hint style="warning" %}
The Supply and Demand Map is required for the workbench to function. Items will only appear in the workbench grid if they have Supply and Demand Map entries linking their Item @ Customer Group to their Item @ Location at the selected location.
{% endhint %}

### Step 7: Set Up Sale Types for Demand

1. Go to Settings > Master Data > [Sale Types](/master-data/sale-types).
2. Create sale types for demand forecasts and history (e.g., "Sales Forecast", "Actual Sales").

{% hint style="info" %}
Sale Types for demand are assigned in your View configuration (Demand tab) to pull in forecast and history data for production planning.
{% endhint %}

### Step 8: Set Up Supply Types

Supply Types categorize your production plans (e.g., "Planned Production", "Scheduled Production").

1. Go to Settings > Master Data > [Supply Types](/master-data/supply-types).
2. Create supply types for your supply plans.

{% hint style="info" %}
Supply Types are assigned in your View configuration (Supply tab). The workbench uses this to store generated supply plan recommendations.
{% endhint %}

### Step 9: Import Sales Forecast Data

1. Go to Settings > Transactional Data > [Sales](/transactional-data/sales).
2. Import your sales forecast and/or history data.

{% hint style="info" %}
Sales forecasts drive the demand side of production planning. Without demand data, the workbench cannot calculate when production is needed.
{% endhint %}

### Step 10: Import Existing Supply Plans (Optional)

1. Go to Settings > Transactional Data > [Supply Plans](/transactional-data/supply-plans).
2. Import any existing supply plans if available.

{% hint style="info" %}
Existing supply plans are displayed in the workbench. You can then edit them or regenerate using the Run Supply Plan feature.
{% endhint %}

### Step 11: Import Inventory Data

1. Go to Settings > Transactional Data > [Inventory](/transactional-data/inventory).
2. Import current inventory levels at each location.

{% hint style="info" %}
Current inventory levels are the starting point for Days on Hand calculations and supply plan recommendations.
{% endhint %}

### Step 12: Check Calendars (Optional)

1. Go to Settings > Master Data > [Calendars](/master-data/calendars).
2. Check existing setup to confirm Fiscal Years are in line with your requirements. Note changing calendars here will affect all areas of Claret.

{% hint style="info" %}
Calendars define fiscal periods for time-based planning. Select calendar-based time settings in your View to use these.
{% endhint %}

## Verifying Your Setup

Once you have completed the setup, verify everything is working:

1. Navigate to the Inventory Workbench - Internal (Pack module).
2. Create a new View and select your Item Hierarchy Type and UOM.
3. Configure the Demand tab with your sales forecast Sale Type.
4. Configure the Supply tab with your Supply Type.
5. Select a location from the dropdown.
6. You should see items appear in the grid.

If no items appear or you see an empty state message, check the following:

* Verify Item @ Location links exist for items at the selected location.
* Verify Item @ Customer Group links exist for those items.
* Verify the Supply and Demand Map connects the Item @ Customer Groups to the Item @ Locations.


# Forecast Workbench

Discover how to optimize demand forecasting using Claret's Forecast Workbench, utilizing statistical models, historical data, and custom configurations."

The Forecast Workbench is a planning tool that allows planning teams to use statistical models with historical sales data to forecast demand into the future.

The workbench uses R modeling techniques and can either automatically select the model that predicts the most likely outcome or allow you to select a model yourself.

The Forecast Workbench is accessed from the main menu.

{% hint style="info" %}
Before using the Forecast Workbench, make sure the Forecast Workbench-related [Application Settings](/application-maintenance/application-settings) have been set.
{% endhint %}

When you first enter the Forecast Workbench page, all Items and Customer Groups are listed on the left of the page. Modeling is done at the Item\@Customer Group level.

![](/files/p8Ab76hthdfyVebgVAFt)

Select the Item and Customer Group you wish to work with by clicking on them. Once selected, the banner at the top will show the Item\@Customer Group info.

{% hint style="info" %}
In order to work with an Item and Customer Group combination within Forecast Workbench, you must already have [defined the combination as an Item@CustomerGroup.](/master-data/item-customer-groups)
{% endhint %}

![](/files/WbSODSE3T2BO8A5exR4m)

If you have used the Forecast Workbench previously for the selected Item\@Customer Group, you will see your previous forecast data. If you have not, you will need to setup the forecast configuration.

### Forecast Configuration

To access the Forecast Configuration, click on the configuration (blue) button in the top right of the screen.

![](/files/6UMvWrFYCSHmSdODKuFB)

On the panel that appears, you can now set the following options:

**Timing and date configuration**

1. Set the 'Timing Interval' based on what level (weeks or months) you want to forecast at. This will dictate at what level the forecast data is saved.
2. Next, choose the 'Forecast history start' and 'Forecast history end'. These are the start and end dates of the data set you want to use as the historical sales data.
3. And finally, choose the 'Forecast horizon in months'. This determines how far into the future the model forecasts.

So, for example, if we are in February, and you wish to use the last 12 months worth of data to forecast the next 12 months worth of data, but in weekly buckets, then your 'Timing and date configuration' would be as follows:

![](/files/0uZmzwuo50BxsZVmG1SV)

Next, we need to set the 'Model configuration'.

**Model configuration**

![](/files/EPi8DOF6MUnGYU2Frsua)

There are two key options when setting up how Claret should model the forecast data.

* Auto - If all options are set to Auto - then Claret will determine the best regression model to use to forecast the data.
* Manual - If you wish to set the model configuration yourself, then the auto function can be turned off by switching the 'Auto' switch across and you can then make your own selections.

![](/files/BfrISmNp5u5oYU06lns3)

1. The 'Model Selection' dictates which regression model you wish Claret to use when creating the future forecast based on historical sales. A number of options are available in the dropdown. Select the model you would like to use. (For further detail on how each of the available models work, see [Forecasting Models](/sell/forecast-workbench/forecasting-models))

![](/files/5FWAHFcD6bN4qh0Svzoz)

2\. The 'Missing Imputation' setting tells Claret how you want the model to handle gaps in history.

![](/files/3knXtMhhwB1CwyTEqsjG)

3\. Setting the 'Forecast Constraint' will indicate any rules Claret should use to constrain values when forecasting. Select 'Positivity' to only allow positive forecast values.

![](/files/mYGebjXCQWsT3KdjWVTN)

**Select 'Save' to save all your configuration settings**

### **Running the Model**

Once you have set your configuration preferences, you are now ready to run the model. To do this, simply hit the 'Play' button in the top right corner

![](/files/824gFh2J1gqQ1VotfGna)

{% hint style="info" %}
The model will need to be rerun via this method whenever you make changes to the configuration.
{% endhint %}

### Model Output

The output you see after you run the model contains 3 sections - a chart, details of a selected data point on the graph, and a table of all values where the forecast can then be overridden.

![](/files/3mAGrhc3IoIXJXTNx6Dk)

1. **The chart**

The chart provides a visual for the historical and projected forecast over time. History data is seen in red and the forecast projected by the model can be seen in blue.

![](/files/syJ0bOeftlpHqpOEOEQH)

If you hover on a point on the chart, you can then see the exact values for that point in the detail below the chart. History data is shown on the 'History' line and forecast values are shown on the 'Forecast' line. For example, hovering over Feb then shows the Forecast figures for that month, including any [overrides](#overriding-forecasts).

![](/files/ujSS5jwj9ylYYLUJQBiX)

{% hint style="info" %}
The historical data used to generate the forecast is highlighted between the 'History start' and 'History end' bars but ALL historical data for the item is shown on the chart.
{% endhint %}

**2. The data**

Below the chart area is a table containing all the data for the Item\@CustomerGroup. Here, you can scroll through time and see the exact values as charted above. If you wish, you can also alter the data by adding overrides. (See [below](#overriding-forecasts)).

![](/files/JZMkBMP6lZK2SCuizsil)

#### Overriding Forecasts

One of the key features of the Forecast Workbench is the ability to override forecast data to view how this would affect the overall forecast.

There are 2 ways you can override the data for a period.

1. Enter the amount by which you wish to change the Hist/Forecast figure into the 'Overrides' box. So, if the Forecast is for 252.85, entering 176.60 into the Overrides box would then add 176.60 to the 252.85 to get a total of 429.55 for the month. (To decrease the forecast total, you would enter a negative value into the Overrides box).

![](/files/3Q3CYJDNQtXYdUKWPiIG)

2\. Enter the total amount you want to change the forecast to into the 'Total' box, and the 'Override' value will then be automatically calculated.

The chart will then update to show the updated value as part of the main chart, but a dotted line to still show the original value.

![](/files/hkZLSuing8IuZVczjpVO)


# Quick Start: Forecast Workbench

Quick start guide for Forecast Workbench — how to select an item and customer group, configure a forecast, run the model, interpret results, and make overrides.

## What You'll Learn

The Forecast Workbench uses statistical models with historical sales data to forecast demand into the future. After this guide, you'll be able to select an Item @ Customer Group combination, review or configure a forecast, run the model, read the output, and apply overrides.

## Before You Begin

Your admin should have already:

* Set up Items, Customer Groups, and Item @ Customer Groups
* Imported historical sales data
* Configured Forecast Workbench settings in Application Settings

If the page appears empty or models won't run, check with your admin that setup is complete. See [Setting Up Forecast Workbench](/using-claret/getting-started/setting-up-modules/setting-up-forecast-workbench) for what's required.

{% hint style="info" %}
The Forecast Workbench requires historical sales data to generate forecasts. The more history available, the better the model's predictions.
{% endhint %}

## Step 1: Access Forecast Workbench

Navigate to **Sell > Forecast Workbench** in the left navigation menu.

<figure><img src="/files/p8Ab76hthdfyVebgVAFt" alt=""><figcaption><p>The Forecast Workbench landing page</p></figcaption></figure>

## Step 2: Select an Item and Customer Group

When you enter the Forecast Workbench, all Items and Customer Groups are listed on the left side of the page.

1. Click on the **Item** you want to forecast
2. Click on the **Customer Group** you want to forecast for
3. The banner at the top will update to show the selected Item @ Customer Group combination

<figure><img src="/files/WbSODSE3T2BO8A5exR4m" alt=""><figcaption><p>Selecting an Item and Customer Group on the left side of the page</p></figcaption></figure>

{% hint style="info" %}
The Item and Customer Group must be linked as an [Item @ Customer Group](/master-data/item-customer-groups) for forecasting to work.
{% endhint %}

## Step 3: Review the Forecast Configuration

If a forecast has been run previously for this combination, you'll see the existing results. To view or adjust the configuration:

1. Click the **configuration button** (blue icon) in the top-right of the screen
2. Review the settings:
   * **Timing Interval** — weekly or monthly forecast buckets
   * **Forecast history start / end** — the date range of historical data used by the model
   * **Forecast horizon** — how many months into the future to forecast
3. Review the model configuration:
   * **Auto** — Claret selects the best regression model automatically
   * **Manual** — you choose the model, missing imputation method, and forecast constraints yourself

<figure><img src="/files/6UMvWrFYCSHmSdODKuFB" alt=""><figcaption><p>The Forecast Workbench configuration panel</p></figcaption></figure>

## Step 4: Run the Model

Once the configuration is set:

1. Click the **Play button** in the top-right corner to run the model
2. Wait for the model to complete — this may take a few seconds depending on the data volume

{% hint style="info" %}
You need to re-run the model whenever you change the configuration. The model does not re-run automatically.
{% endhint %}

## Step 5: Interpret the Results

The output has three sections:

1. **The chart** — shows historical data (red) and the forecast projection (blue) over time. Hover over a point to see exact values.
2. **Point detail** — below the chart, shows the precise history and forecast values for whichever point you hover over on the chart.
3. **The data table** — a scrollable table with all values by time period, including any overrides.

The area between the "History start" and "History end" markers on the chart highlights the data used to generate the forecast. All available history is shown on the chart, but only the selected range feeds the model.

<figure><img src="/files/0uZmzwuo50BxsZVmG1SV" alt=""><figcaption><p>The Forecast Workbench output — chart, point detail, and data table</p></figcaption></figure>

## Step 6: Make Overrides (Optional)

To adjust the forecast for a specific period:

* **By adjustment amount** — enter a value in the "Overrides" field to add to (or subtract from, using a negative number) the forecast
* **By target total** — enter a value in the "Total" field and the override amount will be calculated automatically

The chart updates to show the adjusted value, with a dotted line indicating the original forecast for comparison.

<figure><img src="/files/3Q3CYJDNQtXYdUKWPiIG" alt=""><figcaption><p>Entering an override adjusts the forecast value and updates the chart</p></figcaption></figure>

## Understanding the Data

| Column            | What It Shows                                                                      |
| ----------------- | ---------------------------------------------------------------------------------- |
| **Hist/Forecast** | The original modeled value — history for past periods, forecast for future periods |
| **Overrides**     | Any manual adjustments applied to the forecast                                     |
| **Total**         | The final value (forecast + override)                                              |

## Common Questions

### How much historical data do I need?

More history generally produces better forecasts. At minimum, you need enough data to cover the patterns in your sales (e.g., at least 12 months to capture seasonal trends). Check with your admin about how much history has been imported.

### What if there are gaps in my sales history?

The "Missing Imputation" setting in the model configuration tells Claret how to handle gaps. Options include interpolating missing values or treating them as zero. Check the configuration panel to see what method is being used.

### Can I override the forecast for multiple periods at once?

Overrides are entered one period at a time in the data table. Enter your adjustment for each period you want to change.


# Forecasting Models

Explore the different forecasting models available to use in the Claret App to help you best leverage your past data and make informed predictions about the future.

The statistical models available to use in Claret are mathematical models that use historical data, or other sale types you wish, to predict what will happen in future.

The models available are:

### AR - Autoregressive Models

Autoregression uses observations from previous time steps (lags) as input to a linear regression equation to predict the value at the next time step. It will first establish the lags that correlate most and then apply them as input variables to a linear regression model to predict the future value.

Autoregressive models assume the future to tightly resemble the past and as such will most likely be chosen for clean and seasonal time series.

Links:

* <https://otexts.com/fpp2/AR.html>

### ARIMA - Autoregressive Integrated Moving Average

ARIMA models are an evolution of Autoregressive models. They too predict future values based on past values with the help of a linear regression, which takes past values as an input (that's the AR part of ARIMA). But they transform the past values a little more by (1) removing trend and seasonality to focus the prediction on the underlying data and (2) smoothing these values with a moving average.

ARIMA models are widely used and popular as they can adapt to many types of time series.

Links:

* <https://www.investopedia.com/terms/a/autoregressive-integrated-moving-average-arima.asp>
* <https://otexts.com/fpp3/arima.html>

### ETS - Exponential Smoothing

Forecasts produced by Exponential Smoothing methods are weighted averages of past observations, with the weights decaying exponentially as the observations get older. In other words, the more recent the observation the higher the associated weight.

ETS models come in different degrees of complexity from simple methods to models including trend and seasonal components.

Links:

* <https://otexts.com/fpp3/expsmooth.html>

### Naïve methods

The Naïve method simply uses the last value of the observations as future predictions. Seasonal Naïve methods (SNAÏVE) identify seasonal periods in the data (months, quarters, or else) to set each future value accordingly.

While simple, naïve methods are surprisingly accurate particularly for noisy data.

Links:

* <https://otexts.com/fpp3/simple-methods.html>

### TSLM - Time Series Linear Model

A Time Series Linear Model (TSLM) is a linear regression model that predicts the course of one time series based on another time series. An example would be predicting sales based on marketing expenditure. An example for a single time series would be predicting future values based on previous values.

Links:

* <https://otexts.com/fpp3/regression.html>

### VAR - Vector Autoregression

The VAR model is a more complex model allowing all variables of the model to affect each other. With simple linear regression forecasts, inputs were affecting outputs unidirectionally. A VAR makes sense when relating multiple time series to each other that can affect each other, for example if we wanted to predict sales based on income, we would assume that higher incomes drive sales, which might positively affect incomes.

Links:

* <https://otexts.com/fpp3/VAR.html>


# Long Term Planning

Efficiently build a demand plan spanning years with Claret's Long Term Planning tool.  Customize your layout, manage your plans at any hierarchy level, and reconcile data seamlessly.

The objective of Long Term Planning is to efficiently build out a demand plan that spans years. This demand plan can become your budget or your latest quarterly estimate. The tool allows you to be at any level in your Item and Customer Group hierarchy and enter in your Long Term Demand plans. Regardless of what level you enter your data at, it will find its way to the lowest [Item @ Customer Group](/master-data/item-customer-groups) level via reconciliation.

### Initial page configuration

The first time you come to Long Term Planning, you'll need to configure the layout - the columns of data you wish to see to manage your long term plans and the level at which you wish to plan. The next set of steps walks you through just how to do that. Here we are creating our first Long Term Planning view.

{% hint style="info" %}
For an overview of how Views work within Claret, see [Managing Views](/using-claret/getting-started/managing-views)
{% endhint %}

1. Select the views button in the top-right of the page and click on it.

<figure><img src="/files/wPr0F6WUlLIXBpT9Pgc4" alt=""><figcaption><p>The View menu</p></figcaption></figure>

2. Click on "Configure". You will then see the modal which allows you to configure your view. You may need to select to 'Add' a new view at this point.

<figure><img src="/files/DB5uMoOZbYKChlI0TkaY" alt=""><figcaption><p>Selecting to add a new view</p></figcaption></figure>

3. The first thing you'll want to do is give your view a name. This is the name that will appear in the View menu so you can quickly access the view.
4. Next you'll want to do is choose your Customer Group hierarchy and also select which level of your hierarchy you want to be at. This is the level that you wish to manage your long terms plans at. In this walkthrough, we'll be choosing "State". This will set the first columns in your view.
5. Next, you'll need to choose your Item hierarchy and choose which level you want to plan at for your Items. We'll be choosing "Brand". This will set the next columns in your view.

<figure><img src="/files/QltUg9nv71JOOE3E1Dm1" alt=""><figcaption><p>Naming and selecting hierarchies for our configuration</p></figcaption></figure>

6. Now, we'll set up the type of data we want to show. We can either show a straight sale type (history OR forecast) or a combination type (history and forecast combined). We'll start by choosing our "History" Sale Type that we have for this database. Note: you can add any Sale Type you want.
7. Choose the Calendar of the history for this column. We'll be choosing "FY23".
8. The Growth % allows you to show a growth percentage of this Sale Type/Calendar combo with another Sale Type/Calendar. For now, we will leave this as "Disabled" or off. We'll come back to this in a bit.
9. Leave the 'can edit' check box unchecked. We don't want to update our history.

<figure><img src="/files/qC0ImVWRJ7avazzsOKzA" alt=""><figcaption><p>Adding a sale type to the configuration</p></figcaption></figure>

6. Click the "Save" button. This will close the configure window and the Long Term Planning page will refresh and present data based on the configuration you chose.

<figure><img src="/files/ri7O1LcT4bKazBrbmTNT" alt=""><figcaption><p>Our example Long Term Planning configuration</p></figcaption></figure>

<figure><img src="/files/nQaRAaLD0F5a5PTVNUL5" alt=""><figcaption><p>The view built using our Long Term Planning configuration</p></figcaption></figure>

To build on this simple configuration, let's add another Sale Type along with a Growth %.

1. Go back to the view button in the top-right of the page and click on it.
2. Click on "Configure".
3. Click on the '...' button beside the view name and select 'Edit'

<figure><img src="/files/u2EfMYE444IpEwxrDhk5" alt="" width="563"><figcaption><p>Select to edit the view</p></figcaption></figure>

4. Below the Sales Type row we added previously, we'll add a Sale Type called "LTP".
5. Check the 'can edit' checkbox.
6. Choose the Calendar. We will set this to FY24.
7. Choose Growth %. We'll keep building on our example and choose "History - FY23"
8. Click the "Save" button.

<figure><img src="/files/Phy8M0qbRz9VM3GzuS5J" alt=""><figcaption><p>Adding an editable sale type and growth %</p></figcaption></figure>

<figure><img src="/files/9s0sZ5B5587C5Wh0wb2r" alt=""><figcaption><p>Displaying the new editable Sale Type and its Growth % column</p></figcaption></figure>

### Making updates

Within the Long Term Planning page, you can be at any level of the Item and Customer Group hierarchy and make updates to the annual plan. You have a handful of ways to make your updates:

1. Update volume
2. Update growth percentage

With these various update ways, the end result is the same. The data will reconcile down to the lowest level Item @ Customer Group level. See Reconciliation explanation below to learn more on how Claret reconciles from a higher level down.

Let's walk through each of the four approaches to make your long term planning updates.

#### Update volume

We'll start with updating the value in the LTP column.

1. Double click into the editable cell.
2. Type in your new number.
3. Click outside of the cell.

<figure><img src="/files/ZMZYy1hHKKGFEel3BGpg" alt=""><figcaption><p>Updating the LTP volume for the River Edge brand for Texas</p></figcaption></figure>

#### Update growth percentage

The growth percentage column is a special column that allows you to compare a Sale Type/Calendar combination to another Sale Type/Calendar combination. It also allows you to update your volume via entering in a new growth percentage. By updating the growth percentage, Claret will determine what the equivalent volume is and enter in that volume number to be applied to that row.

1. Double click into the editable Growth % cell.
2. Type in your new percentage. Note: you don't need to add the `%` sign.
3. Click outside of the cell.

<figure><img src="/files/IJ9o0e3AaHHPZcRQHxCx" alt=""><figcaption><p>Updating the Growth % for the Clairemont brand for Texas</p></figcaption></figure>

####

### Sorting and filtering from the columns

Similar to other tabular data in Claret, you sort and filter data from the column headers of the tables.

#### Sort

To sort, just click on the the name of the column. This will toggle between ascending, descending and not sorting.

#### Filtering

1. Hover over the column header you'd like to filter. You will then see the menu icon appear (three horizontal lines)

<figure><img src="/files/pJ8wQv5Xk6HpJYv94uLH" alt=""><figcaption><p>Enabling the header menu</p></figcaption></figure>

1. Click on the menu icon.
2. Chose the kind of filter.
3. Type in the text you want to filter with.

<figure><img src="/files/65ty69TY9W3YgqdgENcr" alt=""><figcaption><p>Filtering the Brand Group column</p></figcaption></figure>

{% hint style="info" %}
To remove the filter, simply click the 'Reset' button
{% endhint %}

### Reconciliation

So, how does the reconciliation work? Let's review the below illustration. In the "Old" column, the ZAM Brand has a total of 100 cases which is the sum of the three items within that brand. In the "New" column, someone has overwritten the 100 cases at the brand level with 200 cases and that has reconciled down to the underlying items based on their respective contribution percentage (derived by their existing quantities) to the brand.

![](/files/-Mkhj2e4_KMBDQbO9sM2)


# Quick Start: Long Term Planning

Quick start guide for Long Term Planning — how to set up your first view, enter annual plans, use growth percentages, and understand reconciliation.

## What You'll Learn

Long Term Planning lets you build demand plans that span multiple years — typically for budgets or quarterly estimates. After this guide, you'll be able to navigate to Long Term Planning, configure or select a view, enter plan data, and understand how growth percentages and reconciliation work.

## Before You Begin

Your admin should have already:

* Set up Items, Customer Groups, and Item @ Customer Groups
* Configured at least one Sale Type for long-term planning (e.g., "LTP", "Budget")
* Created calendar definitions for the fiscal years you want to plan

If the module page is empty or you can't see any data, check with your admin that the setup is complete. See [Setting Up Long Term Planning](/using-claret/getting-started/setting-up-modules/setting-up-long-term-planning) for what's required.

## Step 1: Access Long Term Planning

Navigate to **Sell > Long Term Planning** in the left navigation menu.

## Step 2: Select or Create a View

1. Click the **view button** in the top-right of the page
2. If workspace views are available, select one from the dropdown
3. If you need to create a personal view, click **Configure** and then **Add** to create a new view:
   * Give the view a **name**
   * Select the **Customer Group hierarchy** and the level you want to plan at
   * Select the **Item hierarchy** and the level you want to plan at
   * Add one or more **Sale Type rows** with their associated calendars

<figure><img src="/files/QltUg9nv71JOOE3E1Dm1" alt=""><figcaption><p>Naming and selecting hierarchies for a new Long Term Planning view</p></figcaption></figure>

{% hint style="info" %}
The hierarchy levels you choose in the view configuration determine what granularity you plan at. For example, choosing "Brand" for Items and "State" for Customer Groups means you'll enter plans at the Brand × State level.
{% endhint %}

## Step 3: Understand the Grid Layout

The Long Term Planning grid shows:

* **Left columns** — the Customer Group and Item hierarchy levels you selected in the view, creating a matrix of combinations
* **Data columns** — one column per Sale Type/Calendar combination configured in the view, showing the annual total for each
* **Growth % columns** — if enabled, showing the percentage change between two Sale Type/Calendar combinations

Each row represents a unique combination of Item level and Customer Group level.

<figure><img src="/files/9s0sZ5B5587C5Wh0wb2r" alt=""><figcaption><p>A Long Term Planning grid with hierarchy columns, Sale Type columns, and a Growth % column</p></figcaption></figure>

## Step 4: Enter Plan Data

If a Sale Type column is marked as editable in the view configuration:

1. Click on a **cell** to enter or update a value
2. Enter the annual quantity for that Item × Customer Group combination
3. The value saves automatically

You can enter data at whatever hierarchy level your view is configured for. Claret reconciles higher-level entries down to the Item @ Customer Group detail level automatically using the existing ratios.

## Step 5: Use Growth Percentages (Optional)

Growth percentages let you compare two columns and quickly apply a percentage increase or decrease:

1. In the view configuration, enable **Growth %** on a Sale Type row and link it to another Sale Type/Calendar
2. The grid will show a growth % column that calculates the difference between the two
3. You can **edit the growth %** directly — Claret will calculate and update the target value based on the percentage you enter

This is useful for planning scenarios like "next year's budget is 5% above this year's actuals."

<figure><img src="/files/IJ9o0e3AaHHPZcRQHxCx" alt=""><figcaption><p>Updating the Growth % — Claret calculates the equivalent volume automatically</p></figcaption></figure>

## Understanding the Data

| Column Type                             | What It Shows                                                                   |
| --------------------------------------- | ------------------------------------------------------------------------------- |
| **Sale Type** (e.g., History FY25)      | The annual total for that sale type and calendar — may be read-only or editable |
| **Editable Sale Type** (e.g., LTP FY26) | A column where you can enter or update plan values                              |
| **Growth %**                            | The percentage change between two Sale Type columns                             |

## Common Questions

### How is Long Term Planning different from Sales Collaboration?

Sales Collaboration works with monthly data within a single fiscal year and is typically used for short-to-medium term planning. Long Term Planning works with annual totals across multiple fiscal years and is designed for budgets and multi-year demand plans.

### What happens to the data I enter?

Data entered at any hierarchy level is reconciled down to the lowest Item @ Customer Group level. This reconciled data flows into the [Sales](/transactional-data/sales) data and can be used by downstream modules like Make Planning.

### Can I plan across multiple years in one view?

Yes. Add multiple Sale Type/Calendar rows to your view configuration — one for each fiscal year you want to plan. This lets you see and compare data across years side by side.


# Sales Collaboration

Empower your organization with Claret's Sales Collaboration tool.  Participate in creating a sales plan at any level, reconcile quantities, and build a comprehensive supply chain plan.

Sales Collaboration is a planning tool that allows people across the organization to participate in creating a sales plan at any level in the Item hierarchy and/or Customer Group hierarchy. Through reconciliation, the quantities end up at the lowest level [Item @ Customer Group](/master-data/item-customer-groups) in the [Sales](/transactional-data/sales) data. This allows the sales team or marketing team to enter a forecast at a higher level while allowing the supply team to get the details they need to build out the rest of the supply chain plan.

This video provides you with an overview of how the Sales Collaboration module works.

{% embed url="<https://youtu.be/pfPHMoqjf1I?feature=shared>" %}

Before you can get started with Sales Collaboration, you will need to set up your items and customers, along with sales types, for example 'Budget' or 'Forecast' that you wish to track.

To do this you can step through:

1. [Items](/master-data/items)
2. [Customer Groups](/master-data/customer-groups)
3. [Items @ Customer Groups](/master-data/item-customer-groups)
4. [Sale Types](/master-data/sale-types)
5. [Calendars](/master-data/calendars) (some default calendars have already been set up for you but you will need to review the dates to ensure these are in line with your financial/fiscal year definitions).

Once you have set up your data, you are ready to start [Using Sales Collaboration](/sell/sales-collaboration/using-sales-collaboration)


# Quick Start: Sales Collaboration

Quick start guide for Sales Collaboration — how to access the module, select a view, enter and update a sales plan, understand reconciliation, and export data.

## What You'll Learn

Sales Collaboration is a planning tool that allows people across your organization to participate in creating a sales plan at any level in the Item and Customer Group hierarchies. After this guide, you'll be able to navigate to Sales Collaboration, select a view, understand the grid layout, and enter or update sales plan data.

## Before You Begin

Your admin should have already:

* Set up Items, Customer Groups, and Item @ Customer Groups
* Configured at least one Sale Type (e.g., Budget, Forecast)
* Created a workspace view for you to use

If the module page is empty or you can't see any data, check with your admin that the setup is complete. See [Setting Up Sales Collaboration](/using-claret/getting-started/setting-up-modules/setting-up-sales-collaboration) for what's required.

## Step 1: Access Sales Collaboration

Navigate to **Sell > Sales Collaboration** in the left navigation menu.

## Step 2: Select a View

1. Click the **view name** in the top-right of the header bar
2. Select a **workspace view** from the dropdown or stick with the current selection — this is a view your admin has set up for the team
3. The grid will load with the data configured for that view

<figure><img src="/files/EIYSlsDuvZzFFVFr3I9C" alt=""><figcaption><p>A grid will load based on the view configuration</p></figcaption></figure>

{% hint style="info" %}
If no workspace views are available, you can create a personal view. See [Using Sales Collaboration](/sell/sales-collaboration/using-sales-collaboration) for detailed view configuration instructions.
{% endhint %}

## Step 3: Navigate the Grid

The Sales Collaboration grid shows your sales data organized by hierarchy:

* **Left column** — shows either Items or Customer Groups, depending on the view's hierarchy layout. Click the arrows to expand and see sub-levels.
* **Top header** — shows the alternative hierarchy. Use the dropdown at the top to select which level you want to view data at.
* **Data columns** — show monthly values for each row type configured in the view (e.g., Budget, History, Forecast).

To drill into more detail:

* **Expand hierarchy rows** — click the arrow next to a row to see its children
* **Change the hierarchy level** — use the dropdown picker at the top to view data at a different aggregation level (e.g., from "All" down to a specific region)

<figure><img src="/files/EIYSlsDuvZzFFVFr3I9C" alt=""><figcaption><p>Sales Collaboration with the Item hierarchy expanded</p></figcaption></figure>

## Step 4: Enter or Update Sales Data

If a row is configured as editable (set by your admin in the view configuration):

1. Click on a **cell** in an editable row for the month you want to update
2. Enter the new value
3. The value is saved automatically

<figure><img src="/files/-MkjGjDXx97IeloUR0wh" alt=""><figcaption><p>Editable cells are highlighted so you can see where data can be entered</p></figcaption></figure>

{% hint style="warning" %}
Be careful when editing values. Any changes you make will replace existing data for that cell. If you're unsure which rows are editable, check with your admin or look at the view configuration.
{% endhint %}

## Step 5: Understand Reconciliation

When data is entered at a higher hierarchy level (e.g., "All Domestic" rather than individual customer groups), Claret automatically **reconciles** the data down to the lowest Item @ Customer Group level.

This means:

* You can plan at whatever level makes sense for your role
* The detailed data that supply chain teams need is generated automatically
* Reconciliation runs when you save data at a higher level

<figure><img src="/files/-Mkhj2e4_KMBDQbO9sM2" alt=""><figcaption><p>How reconciliation flows higher-level data down to the Item @ Customer Group detail level</p></figcaption></figure>

For more on how reconciliation works, see [Collaborating on Sales Data](/sell/sales-collaboration/collaborating-on-sales-data).

## Understanding the Data

| Row Type                     | What It Shows                                                                                                                  |
| ---------------------------- | ------------------------------------------------------------------------------------------------------------------------------ |
| **Sale Type** (e.g., Budget) | A single sale type's data for a chosen calendar                                                                                |
| **Hist/Fcst**                | History for past months, forecast for future months — switches at the configured forecast start date (in Application Settings) |
| **Equation**                 | A calculated row (e.g., the difference between Budget and Hist/Fcst)                                                           |

Trend charts may also appear as a column if enabled in the view, showing a sparkline of each row's data over time.

## Common Questions

### Can I edit any cell in the grid?

Only cells in rows marked as "can edit" in the view configuration are editable. Your admin controls which rows are editable in workspace views. If you create a personal view, you can set this yourself. Your admin may have also constrained your permissions to only be able to edit certain items and customer groups. If you are not able to edit data you are expecting to, contact your admin.

### What happens when I enter data at a higher hierarchy level?

The value is reconciled down to the lowest Item @ Customer Group level proportionally. This means downstream modules like Make Planning receive the detail they need.

### How do I see data for a different time period?

Time periods are tied to the calendar configured in each view row. To see a different fiscal year, your admin can add another row with a different calendar, or you can create a personal view with the calendar you need.


# Using Sales Collaboration

Sales Collaboration can be set up to view your data in many different ways. Learn how to use Views to unlock the full power of Sales Collaboration.

Sales Collaboration allows you to view and manage your Sales plans into the future, broken down into monthly buckets.

Whenever you are using the Sales Collaboration module, you will need to have an Active View selected to build out your data.

The name of the view you are currently on can be seen at any time in the header bar's top right.

![Active view in Sales Collaboration](/files/IZtku2IAszsKTQ21JT0q)

### Views in Sales Collaboration

The first time you come to Sales Collaboration, if you are the main administrator, you will need to configure the default view for your workspace. The next set of steps walks you through how to do that.

If you are a general user, the following steps can also be used to create your own personal views.

<figure><img src="/files/sItZNH7asrz9OLnhWcRm" alt=""><figcaption><p>When you first go to the Sales Collaboration page, you will need to configure your page</p></figcaption></figure>

To create new views, edit existing views, or even just to see the configuration of your views, you will need to select the 'Configure' option in the views menu.

1. Go to the option menu accessed via the button containing the current view in the top-right of the page and click on it.
2. Click on "Configure".

![](/files/sSUyy7Bc2mJ7YlP4JnxE)

You can then either choose the view you wish to edit from the dropdown, or, select another option from the menu accessed via the ellipses.

Choose an existing view:

![](/files/S0jH6jNnDFFkl6GDpRq6)

Choose from the extended menu:

<figure><img src="/files/cXO82zt0dMAh02QpeLbM" alt=""><figcaption></figcaption></figure>

The extended menu allows you to:

1. Add - add a new view
2. Duplicate - duplicate the existing view selected in the menu and then edit it
3. Edit - directly edit the currently selected view, or
4. Delete - delete the currently selected view

We'll first look at creating a new view.

### Creating a View

When creating a new view, you'll want to select 'Add' from the extended menu found under the ellipses. (Note, if this is the first view being created, you will automatically be in 'Add' mode when you begin.)

We will now create a simple view as a starting point.

1. The first thing you'll then need to do is to give the view a name.

<figure><img src="/files/guvjrefYkYRoxNsTB5aK" alt=""><figcaption><p>Give the new view a name</p></figcaption></figure>

2\. If you are an administrator you will can also set the view as a Workspace view so all users in your workspace can use it. (This will add a 'w' in brackets after your view name.)

<figure><img src="/files/x636eSY84qTQA5WX7hdk" alt=""><figcaption></figcaption></figure>

3. Choose which Item Hierarchy Type and Customer Group Hierarchy Type you wish to use. If this is the first view you are creating, select the Default Item Hierarchy and Default Customer Group Hierarchy. Note: You can adjust this later as you start getting used to how hierarchies work.

<figure><img src="/files/rMO6zt89QZRxbf1cylJW" alt=""><figcaption><p>Select item and customer group hierarchies</p></figcaption></figure>

4. You'll want to choose the primary hierarchy layout to use. For now, let's choose "Display by Customer Groups". Note: You can adjust this later as you start getting used to how this page works.

<figure><img src="/files/mHTQsOV866KdON1gQo3o" alt=""><figcaption><p>Select the primary hierarchy layout</p></figcaption></figure>

5. Next we want to choose our first "Row Type". Let's choose "Sale Type".
6. Once you have chosen "Sale Type", you'll want to choose which Sale Type you want to see on the first row. In our sample database, we have "Budget", "Forecast" and "History". We'll go with "Budget".

6\. Leave "can edit?" unchecked. We do not want to edit the "Budget" Sale Type in Sales Collaboration.

7\. Choose the "Calendar". In this example, we'll choose "FY24".

<figure><img src="/files/NcLBpb6JIcHzzTDFWzjO" alt=""><figcaption><p>Adding a row to a Sales Collaboration view</p></figcaption></figure>

8\. Click the "Save" button.

9\. Now, to show the data, go to the dropdown by the title of the page and click on the top level - 'All'.

<figure><img src="/files/QeZDqncl2ul5s0L8LOxi" alt=""><figcaption><p>To see data, click on a level in the hierarchy from the dropdown</p></figcaption></figure>

We have now configured a very simple Sales Collaboration page that has one row, the Budget Sale Type.

<figure><img src="/files/H1A8OkLvV457lok29Nz6" alt=""><figcaption><p>Simple configuration for the Sales Collaboration page</p></figcaption></figure>

In the left hand column, you can see Items. This is because we selected 'Display by Customer Groups' as our hierarchy layout. So this allows us to select what customer group level we want to view the data by (in the header) and thens shows us data at that customer group level for each item.

To see the data at a lower level, you can make a different selection in the Customer Group selector up the top and/or expand the items in the left hand column.

<figure><img src="/files/EIYSlsDuvZzFFVFr3I9C" alt=""><figcaption><p>Sales Collaboration with the Item hierarchy expanded</p></figcaption></figure>

#### Add a "History and Forecast" composite row

Let's add an additional row that combines year to date sales with forecast sales. We will also want to make the forecast portion of this row editable so we can update this with our forecasts.

1. Return to the Configure option in the top right menu and make sure you are still looking at the configuration for the view that was just created.
2. Under the row you added above (the Budget Sale Type), choose the "Hist / Fcst" Row Type.
3. There are two Sale Types to choose. In the first Sale Type, choose "History". In the second Sale Type, choose "Forecast". Click on the "can edit?" checkbox for the "Forecast" Sale Type.
4. The Calendar will be automatically set to the Current Fiscal Year (set in [Application Settings](/application-maintenance/application-settings))
5. Click "Save".

<figure><img src="/files/qAwoRIFrAZbuKCxmuOiR" alt=""><figcaption><p>Sales Collaboration configuration highlighting the History and Forecast composite row</p></figcaption></figure>

The Sales Collaboration view now contains a second row at each level showing the History/Forecast. The change from History to Forecast will occur in the month set as the 'Forecast Start Date' in [Application Settings](/application-maintenance/application-settings). In our example this is set to August 1st.

<figure><img src="/files/xV9nO4aXY9uS6WVMjjRa" alt=""><figcaption><p>Sales Collaboration view containing 2 rows</p></figcaption></figure>

#### Add an equation

There is one more Row Type to review and that is the Equation Row Type. This allows you to create an equation that references other rows. For this example, let's get the difference between the Budget row and the History / Forecast row.

1. Go to the "Options" button (the ellipses) in the top-right of the page and click on it.
2. Click on "Configure" and then select to Edit the existing view.
3. Choose "Equation" for the next Row Type.
4. In the "Equation definition" input box, type: `r2 - r1`. The "r1" and "r2" are the references for each of the two rows you created earlier.
5. In the "Label" input box, type in the label for this equation (e.g. "Delta"). This label will be displayed in the Sales Collaboration page for this equation.
6. Select a format for the output - This can be 'Number' or 'Percent'
7. Click "Save".

<figure><img src="/files/YHiWqWlmJH6ek4474gLD" alt=""><figcaption><p>Adding an Equation Row Type and referencing other rows in the equation</p></figcaption></figure>

{% hint style="info" %}
The "Equation" Row Type, can be any basic arithmetic formula using other rows along with any constants. For example, if I wanted the percentage over or under of the History & Forecast vs the Budget, I would enter in this equation: `((r2 - r1) / r1) * 100`
{% endhint %}

If you want to add more row types to fill out your Sales Collaboration page, go for it. We just walked through the three Row Types to choose from. Be creative.

{% hint style="danger" %}
Be careful on how you use the "can edit?" checkbox as you add more Row Types. If you make something editable and you edit the data in the Sales Collaboration page, it will replace any existing data.
{% endhint %}

<figure><img src="/files/Qn0loWrXhaYEUrSmAdZd" alt=""><figcaption><p>Example of a Sales Collaboration page with the three Row Types that were reviewed</p></figcaption></figure>

#### Show trend charts

Within the view configuration you can also add trend charts to each row to graph your sales numbers over time.

1. Go to the "Options" button (the ellipses) in the top-right of the page and click on it.
2. Click on "Configure" and then select to Edit the existing view.
3. Check the 'Show trend chart per row' checkbox.
4. Select 'Save'.

<figure><img src="/files/qMxMz8YEdOwk0BdvoEIk" alt=""><figcaption></figcaption></figure>

A trend chart column is then added, charting the sales in each row.

<figure><img src="/files/XntJZy6Mp6pcVL355XV3" alt=""><figcaption></figcaption></figure>

### Navigating the Grid

We have made it easy to go up and down the Item and Customer Group hierarchies within Sales Collaboration to provide you the ability to work and view data at any level you want. Depending on the hierarchy layout in the Configuration for the view you are on (see below for details), on the far left you see the other hierarchy listed out in a way that you can dive down or roll up. For instance, if you chose "Display by Items" in your configuration, after selecting the level of the Item hierarchy to start with, you'll see the Customer Groups on the left-hand side of the page. Here you can show the details per level or roll up different levels.

<figure><img src="/files/8amVd6f2cTMJGk7tTAXV" alt=""><figcaption><p>Showing the Customer Group hierarchy is on the left and the Item hierarchy is on the top</p></figcaption></figure>

Once you have your base view configured, which may well not yet contain any sales figures, you can begin [Collaborating on Sales Data](/sell/sales-collaboration/collaborating-on-sales-data)!


# Collaborating on Sales Data
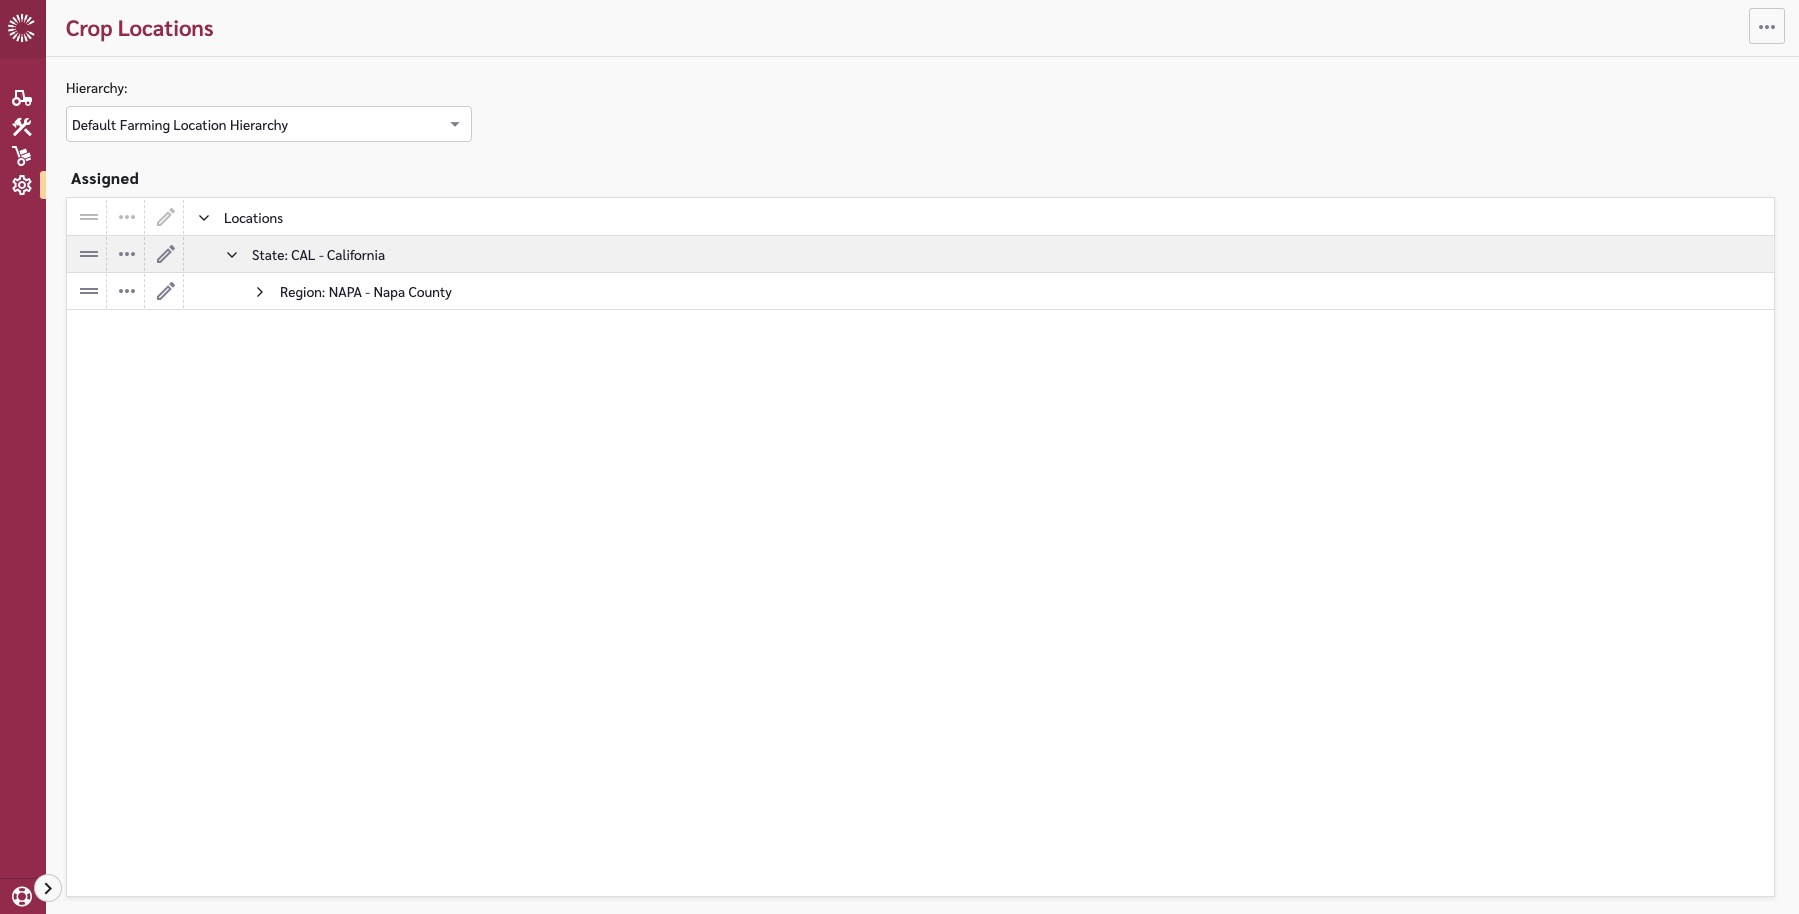
Discover how to collaborate on sales data with Claret. Understand the reconciliation process, learn how to spread forecast data, and make impactful updates to your sales plan.

The power of Sales Collaboration is in the ability to work with and manage the same set of data across the business so that everyone is always on the same page.

## Creating and Updating sales plans

The main objective in Sales Collaboration is creating and making updates to the sales forecasts. When we configured the Sales Collaboration page earlier in our [Using Sales Collaboration](/sell/sales-collaboration/using-sales-collaboration) instructions, we added the "Hist / Fcst" Row Type. We made the "Forecast" Sale Type editable.

When you make a Sale Type editable, you'll see in the Sales Collaboration page where you can make edits or updates to your sales plan.

![Showing the editable fields](/files/-MkjGjDXx97IeloUR0wh)

To make an update, simply type in your new number and hit enter or tab to the next cell.

{% hint style="info" %}
Unless you are at the lowest level of the Item hierarchy and the lowest level of the Customer Group hierarchy, when you make an update, Claret will take your number and spread it or reconcile it down to the lowest level Item @ Customer Group for that month. See the Reconciliation section below to read more on how this is done.
{% endhint %}

### Reconciliation

So, how does the reconciliation work? Let's review the below illustration. In the "Old" column, the ZAM Brand has a total of 100 cases which is the sum of the three items within that brand. In the "New" column, someone has overwritten the 100 cases at the brand level with 200 cases and that has reconciled down to the underlying items based on their respective contribution percentage (derived by their existing quantities) to the brand.

![Simple example showing how reconciliation works in Sales Collaboration (and Long Term Planning, by the way)](/files/-Mkhj2e4_KMBDQbO9sM2)

{% hint style="info" %}
This reconciliation methodology is also used in Long Term Planning.
{% endhint %}

### Spreading forecast data

At the end of each row of data, there is aggregated values for half years (H1 and H2) and quarters (Q1, Q2, Q3 and Q4). These show the total value for the months they cover. For example, if Oct, Nov and Dec have sales data of 6850, 7144 and 9329 units respectively, and your [calendar](/master-data/calendars#calendars) is set up to define Q4 as Oct 1 through Dec 31, then the Q4 total will be the sum of these.

<figure><img src="/files/rDCdsF2zzRHWzGP23W1h" alt=""><figcaption></figcaption></figure>

If the Sale Type we are working with is editable, then we can use these aggregated figures to also make updates to each period. The way we do this is by 'spreading' the forecast data.

For example, if we wanted to update our Q4 forecast above to be 26000, we could do this by clicking on the value, and entering this into the value box.

![](/files/0wLk6Me3tmZ1yLnSNF2s)

Once we do this and save, as is noted in the box, this will then 'spread' the forecast across Q4. The spread happens in a weighted manner so that the contribution each month was making to the quarter is maintained.

<table><thead><tr><th width="150">Month</th><th width="159">Original value</th><th width="182.339908952959">Contribution to original total</th><th>New value</th></tr></thead><tbody><tr><td>Oct</td><td>6850</td><td>6850/23322 = 29%</td><td>26000 x 29%</td></tr><tr><td>Nov</td><td>7143</td><td>7143/23322 = 31%</td><td>26000 x 31%</td></tr><tr><td>Dec</td><td>9329</td><td>9329/23322 = 40%</td><td>26000 x 40%</td></tr></tbody></table>

Spreading the forecast in this way will also result in a reconciliation downwards as well if the spreading is being done at a parent level. (See [#reconciliation](#reconciliation "mention"))

<figure><img src="/files/F7S1IvRaYph13cYaie08" alt=""><figcaption></figcaption></figure>

{% hint style="warning" %}
Spreading the forecast using this feature can result in a lot of data being updated very quickly so make sure you are clear on what will change when using this feature. You may wish to have a sale type you use to test spreading forecasts prior to making updates to your actual forecasts.
{% endhint %}

What happens though if you use this feature on a combined history and forecast row (Hist/Fcst)? In this instance, the 'spread' will first take away any historical data that can't be updated, and will only spread across forecasts.

For example, if we are in August, and wish to update H2, July has already past, so we won't be able to change the data for July. Spreading the H2 forecast will first subtract the July value, and then spread the remainder over the remaining months. So if are moving the H2 total for the CLM Central Coast White from 31,759 to 33,000, the July figure (2607) will first be subtracted because we can't change that now. So we will have 33,000 - 2607 = 30393 to spread across August - December (and July will remain at 2607).


# Inventory Workbench - Partner

Manage shipment forecasts to distributors by tracking distributor inventory levels, depletion forecasts, and days on hand targets.

Managing inventory across your distribution network is complex. You need visibility into what your partners have on hand, how quickly they're selling through, and when they'll need replenishment. Without this visibility, you risk either overshipping (tying up your partners' capital) or undershipping (leading to stockouts and lost sales).

Claret's Inventory Workbench - Partner is designed to solve this problem by bringing together, in one place, your:

* Partner inventory levels at each distributor location
* Depletion forecasts showing how quickly partners are selling through
* Days on Hand (DOH) targets for each partner
* Shipment recommendations to maintain target inventory levels

This allows you to see your partners' inventory position across all items, identify where shipments are needed, and plan replenishment to maintain optimal stock levels at each partner location.

{% hint style="info" %}
For the Inventory Workbench - Partner module to work correctly, there will need to be some Master Data set up. For details please visit [Inventory Workbench - Partner Setup](/sell/inventory-workbench-partner/inventory-workbench-partner-setup)
{% endhint %}

## Navigating to the Inventory Workbench

To access the Inventory Workbench - Partner module, go to the Sell module and select 'Inventory Workbench - Partner'.

<figure><img src="/files/qy7eK4tb6xhtjUGall4N" alt=""><figcaption></figcaption></figure>

## Creating a View

Before you can use the workbench, you must create a View that defines how data is displayed and calculated.

### Create a New View

1. Click on the View dropdown in the top-right corner of the page.
2. Click "Add View".
3. Enter a name for your View and select 'Workspace view' if you wish all users of the module to be able to use the view. (Note the default is for the view to be a personal view only)
4. Configure the View settings (see below).
5. Click "Save".

<figure><img src="/files/n7fM2q5PEWdOnxA8Zfbv" alt=""><figcaption></figcaption></figure>

The View configuration screen lets you set the data to use in the view.

Options are required for:

* **Item Hierarchy Type** - The item hierarchy you wish to work with
* **Unit of Measure** - The UOM for display and calculations
* **Time Settings** - Configure planning periods (calendar-based or continuous days/weeks/months)
* **Choose Locations to include** (optional) - Select one or more locations to restrict which partner locations appear in the sidebar. Leave empty to show all available locations.

There are then 4 tabs where you will need to select options to configure your View.

### Demand Tab

The Demand tab is where you configure which sale types represent partner depletion data. Depletion data shows how quickly your partners are selling through their inventory.

<figure><img src="/files/W23KUfbCZnTMj5scUatI" alt=""><figcaption></figcaption></figure>

| Field    | Description                                                                                                                                       |
| -------- | ------------------------------------------------------------------------------------------------------------------------------------------------- |
| Forecast | Select the sale type that contains partner depletion forecasts. This is used to project future demand and calculate when replenishment is needed. |
| History  | Select the sale type that contains historical partner depletion data. This provides actual sales-through data from your partners.                 |

The workbench uses this depletion data to:

* Calculate how quickly inventory is being consumed at each partner location
* Project when partners will run low on stock
* Inform Days on Hand calculations

### Supply Tab

The Supply tab is where you configure which sale types represent shipments to your partners.

<figure><img src="/files/VbelI6bRkzTN1D9Db7EA" alt=""><figcaption></figcaption></figure>

| Field    | Description                                                                     |
| -------- | ------------------------------------------------------------------------------- |
| Forecast | Select the sale type that contains planned or forecasted shipments to partners. |
| History  | Select the sale type that contains historical shipment data to partners.        |

The workbench uses this supply data to:

* Show planned shipments in the detail grid
* Track historical shipment patterns
* Calculate the impact of shipments on partner inventory levels

### Inventory Tab

The Inventory tab is where you configure Days on Hand calculations and display settings.

<figure><img src="/files/m8PB9mLClwO5ZfFpGnrp" alt=""><figcaption></figcaption></figure>

| Field                    | Description                                                                                             |
| ------------------------ | ------------------------------------------------------------------------------------------------------- |
| Additional Calendars     | Select additional calendars to use for time-based calculations.                                         |
| Days on Hand Calculation | Choose whether to calculate DOH based on Beginning Inventory or Ending Inventory.                       |
| Conditional Formatting   | Configure visual indicators (e.g., highlight cells where DOH is greater than or less than a threshold). |

These settings control:

* How Days on Hand values are calculated in the detail grid
* Visual formatting to highlight items that need attention
* Time period alignment for planning calculations

### Charts Tab

The Charts tab allows you to configure up to 4 visualizations that appear in the detail view when you select an item.

<figure><img src="/files/Swh834GyViiqq4CnBNUQ" alt=""><figcaption></figcaption></figure>

Available chart types include:

| Chart Type   | Description                                                                      |
| ------------ | -------------------------------------------------------------------------------- |
| Days on Hand | Shows projected DOH over time based on current inventory and depletion forecasts |
| Depletion    | Displays historical and forecasted depletion trends                              |
| Inventory    | Shows inventory level changes over time                                          |
| Shipments    | Displays planned and historical shipments to the partner                         |

Charts provide a visual representation of the data in the detail grid, making it easier to identify trends and plan replenishment timing.

## Using the Sidebar Filter

The sidebar filter is where you select which partner location and items to view in the workbench. Use the toggle button on the left edge of the screen to show or hide the sidebar filter.

### Sidebar Filter Toggle

A pill-shaped toggle button appears on the left edge of the workbench:

* When collapsed, it shows "Show filter"
* When expanded with selections made, it displays a summary (e.g., "5 items @ Partner A Warehouse")
* Click the toggle to expand or collapse the sidebar filter
* Your selections persist when you collapse and reopen the sidebar filter

<figure><img src="/files/k2WQMCPjwZ6N7WdnnHZ3" alt=""><figcaption></figcaption></figure>

### Selecting Items and Location

You must select both a partner location and items to view data in the workbench.

1. Open the sidebar filter using the toggle button.
2. In the Location section, search or browse for your partner location and click to select it. If your View is configured with a **Choose Locations to include** filter, only those locations will be listed.
3. In the Items section, browse or search the item hierarchy tree:
   * Use checkboxes to select individual items
   * Click the cards icon beside a hierarchy level to automatically select all items underneath
   * The header shows how many items are selected (e.g., "Items (5 selected)")
4. Click "Apply" to confirm your selections and load the grid.

{% hint style="warning" %}
Only partner locations that have Item @ Location and Item @ Customer Group links (via the Supply and Demand Map) appear in the location list.
{% endhint %}

## The Inventory Workbench Grid

The main grid provides an at-a-glance view of Days on Hand across all items at the selected partner location. Each row represents an item, and the time period columns show DOH values calculated from the underlying depletion forecasts, inventory levels, and shipment data.

<figure><img src="/files/z7pF2D4Qdt6k2UJXwa0W" alt=""><figcaption></figcaption></figure>

{% hint style="warning" %}
Collapse the item and location filter for better viewing of the grid.
{% endhint %}

### Grid Columns

| Column              | Description                                                                          |
| ------------------- | ------------------------------------------------------------------------------------ |
| Item Hierarchy      | Item parents, Item name and description based on your selected hierarchy             |
| DOH                 | Indicates data is showing Days on Hand                                               |
| Trend               | Sparkline chart showing DOH trend over time                                          |
| Time Period Columns | Days on Hand value for each period (month, week, or day based on your View settings) |

Days on Hand values are color-coded to highlight items needing attention:

* **Red** indicates DOH is below your configured threshold (potential stockout risk)
* **Indigo** indicates DOH is above your configured threshold (potential overstock)
* **∞** (infinity symbol) appears when DOH exceeds 365 days

{% hint style="info" %}
The main grid shows summarized DOH values. To see the underlying depletion forecasts, inventory levels, and shipment details, click on a row to open the detail view.
{% endhint %}

### Filtering the Grid

1. Hover over a column header to reveal the filter menu icon.
2. Click the menu icon to open the filter options for that column.
3. Enter filter criteria or select values to filter by.
4. The grid updates automatically to show only matching rows.

### Viewing Item Details

Click on any row in the grid to open the detail view showing comprehensive item information for the partner.

<figure><img src="/files/bvkK7VQ84BB6kOrLi9IS" alt=""><figcaption></figcaption></figure>

## Working with the Detail View

The detail view is where you analyze and manage inventory for a specific item at the partner location. Use it to:

* See how depletion forecasts and shipments affect inventory levels over time
* Identify when a partner will run low on stock
* Adjust planned shipments to maintain target Days on Hand
* Spread forecasts across time periods

The detail view contains:

* **Header** - Shows item name, description, and partner location
* **Detail Grid** - Hierarchical tree view showing depletion, inventory, and DOH data by time period
* **Charts** - Up to 4 visualizations based on your View configuration

### Detail Grid Structure

The detail grid displays data in a tree structure with the following rows:

| Row                 | Description                                                                                                                                                               |
| ------------------- | ------------------------------------------------------------------------------------------------------------------------------------------------------------------------- |
| Beginning Inventory | Starting inventory for each period. For the first period, this is the actual current inventory. For subsequent periods, it equals the previous period's ending inventory. |
| Demand              | Parent row containing depletion data. Expand to see Forecast and History sub-rows.                                                                                        |
| Supply              | Parent row containing shipment data. Expand to see planned and historical shipments.                                                                                      |
| Ending Inventory    | Closing inventory for each period.                                                                                                                                        |
| Days on Hand        | How many days the ending inventory will last based on forecasted depletion.                                                                                               |

### How Calculations Work

**Ending Inventory** is calculated for each period as:

```
Ending Inventory = Beginning Inventory - Demand + Supply
```

**Days on Hand** looks forward from each period to determine how long the inventory will last:

1. Starting with the ending inventory for the period
2. Subtracting forecasted demand from each future period
3. Counting days until inventory runs out
4. If inventory covers all visible periods, DOH shows as **∞** (infinity)

{% hint style="info" %}
The DOH calculation uses forecasted depletion data to project how quickly the partner will sell through their inventory. Higher DOH means more runway; lower DOH indicates replenishment is needed soon.
{% endhint %}

### Editing Supply Values

You can edit planned shipment quantities directly in the detail grid:

1. Click on an editable cell in the Supply row (cells at or after the plan start date).
2. Enter a new quantity.
3. Press Enter or click outside the cell to save.

<figure><img src="/files/puhUgxiOfTltUAFyi5SA" alt=""><figcaption></figcaption></figure>

When you edit a supply value:

* The new shipment quantity is saved immediately
* Ending inventory recalculates for that period and all future periods
* Days on Hand recalculates to reflect the updated inventory projection

{% hint style="info" %}
Only Supply row cells can be edited, and only for periods at or after the plan start date. The plan start date is indicated by a marker on the column header.
{% endhint %}

## Configuring Planning Parameters

Planning parameters control how demand calculations are performed for each item at a partner location.

### Open Planning Parameters

1. Open the detail view for an item.
2. Click the Settings (tune) button in the header.
3. A sidebar opens with planning parameter options.

### Planning Parameter Options

| Parameter       | Description                         |
| --------------- | ----------------------------------- |
| Plan Start Date | When to begin planning calculations |

## Reconciling Forecasts

The Partner workbench supports reconciling period-level forecasts across multiple time periods. This is useful when you need to adjust how a total forecast is distributed across weeks or months.

### Spread Forecast

1. Open the detail view for an item.
2. Locate the forecast values in the detail grid.
3. Adjust period allocations as needed to reconcile the forecast. For example, click on the 'H1' total, and the option to spread a forecast will open.
4. Changes are saved automatically.

<figure><img src="/files/wiEyErmppfGydgY8VADu" alt=""><figcaption></figcaption></figure>

## Empty States

If you see an empty state message, follow these steps to resolve it:

| Message                | Resolution                                                                     |
| ---------------------- | ------------------------------------------------------------------------------ |
| No View configured     | Create a View using the View dropdown                                          |
| No Supply/Demand links | Configure links in [Supply and Demand Map](/master-data/supply-and-demand-map) |
| No Location selected   | Select a partner location from the dropdown                                    |
| Location has no links  | Configure Supply and Demand Map links for this partner location                |


# Quick Start: Inventory Workbench - Partner

Quick start guide for Inventory Workbench - Partner — how to create a view, select a partner location, read the DOH grid, edit shipment quantities, and spread forecasts.

## What You'll Learn

Inventory Workbench - Partner helps you manage inventory at your partner (distributor) locations by tracking demand, supply, and days of hand (DOH). After this guide, you'll be able to navigate to the module, select or create a view, understand the grid and detail view, and edit shipment quantities.

## Before You Begin

Your admin should have already:

* Set up Items, Customer Groups, and Item @ Customer Groups
* Configured Partner Locations and Item @ Locations
* Set up the Supply and Demand Map for partner inventory
* Configured Sale Types for depletion and shipment data

If the module page is empty, check with your admin that the setup is complete. See [Setting Up Inventory Workbench - Partner](/using-claret/getting-started/setting-up-modules/setting-up-inventory-workbench-partner) for what's required.

## Step 1: Access Inventory Workbench - Partner

Navigate to **Sell > Inventory Workbench - Partner** in the left navigation menu.

<figure><img src="/files/qy7eK4tb6xhtjUGall4N" alt=""><figcaption><p>The Inventory Workbench - Partner menu item in the navigation</p></figcaption></figure>

## Step 2: Create or Select a View

1. Click the **view button** in the top-right of the page
2. Select an existing **workspace view** if one is available
3. To create a new view, click **Configure** then **Add**:
   * Give the view a name
   * Select the **Demand** tab to configure which sale types represent depletion data
   * Select the **Supply** tab to configure which sale types represent shipment data
   * Select the **Inventory** tab to configure inventory data sources
   * Optionally, configure the **Charts** tab for visual analysis

<figure><img src="/files/n7fM2q5PEWdOnxA8Zfbv" alt=""><figcaption><p>The Inventory Workbench - Partner view configuration screen</p></figcaption></figure>

## Step 3: Use the Sidebar to Filter Data

1. Toggle the **sidebar** open using the sidebar button
2. Select a **partner location** from the location list
3. Select one or more **items** from the item picker (or use Select All)
4. Click **Apply** to load data for your selection

The grid will populate with inventory data for the selected items at the chosen partner location.

<figure><img src="/files/k2WQMCPjwZ6N7WdnnHZ3" alt=""><figcaption><p>The sidebar with the partner location and item picker</p></figcaption></figure>

## Step 4: Read the Grid

The main grid shows a summary row for each item with key metrics:

| Column   | What It Shows                                                                                                                |
| -------- | ---------------------------------------------------------------------------------------------------------------------------- |
| **Item** | The product name                                                                                                             |
| **DOH**  | Days on Hand — how many days of inventory are projected to remain based on current depletion rates at the end of each period |

Items are color-coded based on their DOH status — helping you quickly identify which items need attention.

<figure><img src="/files/z7pF2D4Qdt6k2UJXwa0W" alt=""><figcaption><p>The main grid showing summary rows with DOH</p></figcaption></figure>

## Step 5: Work with the Detail View

Click on an item row to open the **detail view**, which shows a time-period breakdown:

* **Demand rows** — depletion data by period (history and forecast)
* **Supply rows** — shipment data by period
* **Inventory rows** — opening and closing inventory by period
* **DOH row** — calculated days of hand for each period

The detail grid lets you see how inventory levels change over time and identify future stockout risks.

<figure><img src="/files/bvkK7VQ84BB6kOrLi9IS" alt=""><figcaption><p>The detail view for an item, showing demand, supply, inventory, and DOH by period</p></figcaption></figure>

## Step 6: Edit Shipment Quantities

If your view is configured to allow editing:

1. Open the **detail view** for an item
2. Click on a cell in an **editable supply row** for the period you want to adjust
3. Enter the new shipment quantity
4. The DOH and inventory calculations update automatically

<figure><img src="/files/puhUgxiOfTltUAFyi5SA" alt=""><figcaption><p>Editing a shipment quantity in the detail view</p></figcaption></figure>

## Understanding the Data

**Days of Hand (DOH)** is the key metric in this module. It represents how many days the current inventory will last based on the depletion rate. A low DOH signals that a shipment may be needed soon.

The module uses the **Supply and Demand Map** configured by your admin to determine which supply item\@locations can meet demand for item\@customergroups.

## Common Questions

### What's the difference between Internal and Partner?

Inventory Workbench - Partner tracks inventory at distributor/partner locations using depletion and shipment data. Inventory Workbench - Internal tracks inventory at your own locations using supply plans and production data. See [Inventory Workbench - Internal](/pack/inventory-workbench-internal) for the internal module.

### How is DOH calculated?

DOH is calculated by dividing the current inventory by the average daily depletion rate. The exact calculation depends on the forecast period and configured depletion data.

### Can I spread a forecast across multiple periods?

Yes. The reconcile forecasts feature allows you to distribute a total forecast quantity across time periods. Check with your admin if this functionality is enabled in your view.


# Inventory Workbench - Partner Setup

Set up your Inventory Workbench - Partner in Claret with our detailed guide. Understand the master data requirements and configure your items, partners, and supply/demand mappings.

In order to use the Inventory Workbench - Partner module and manage shipment forecasts to your distributors, there are master data items that need to be configured. Many of these are also used in other modules and so may already be set up, but here we will walk through what information is needed and how this informs the Partner Workbench.

## Core Data

The foundation of the Partner Workbench is built on three key elements, and the relationships between them:

1. **Items** - The products you ship to partners
2. **Customer Groups** - Your distributors and partners
3. **Locations** - Your supply locations (where products ship from)

These are connected through Item @ Customer Groups, Item @ Locations, and the Supply and Demand Map.

The following steps take you through each set of data required to get Inventory Workbench - Partner up and running.

<figure><img src="/files/IlCEMlqQ7RpDZ0GMa2ri" alt=""><figcaption></figcaption></figure>

## Master Data Requirements

Follow these steps to configure the master data required for Inventory Workbench - Partner.

### Step 1: Set Up Your Item Hierarchy and Items

The Item Hierarchy Type you select in your View configuration determines which items appear in the workbench.

1. Go to Settings > Master Data > [Item Hierarchy](/master-data/item-hierarchy).
2. Create or finalise a Finished Goods Item Hierarchy.
3. Go to Settings > Master Data > [Items](/master-data/items).
4. Add items to the hierarchy.

### Step 2: Set Up Your Customer Group Hierarchy and Customer Groups

Customer Groups represent the groups you sell to.

1. Go to Settings > Master Data > [Customer Group Hierarchy](/master-data/customer-group-hierarchy).
2. Create or finalise a Customer Group Hierarchy.
3. Go to Settings > Master Data > [Customer Groups](/master-data/customer-groups).
4. Create customer groups representing your distribution partners.

### Step 3: Link Items to Customer Groups

Item @ Customer Group links define which items are sold to/which customer. A row appears in the workbench for each item linked to the selected customer group.

1. Go to Settings > Master Data > [Item @ Customer Groups](/master-data/item-customer-groups).
2. Create links between items and the customers you sell them to.

{% hint style="info" %}
Item @ Customer Group links should represent your end customers or market segments, not the partner location itself. The Partner Workbench aggregates demand and supply data across all customer groups mapped to the selected location via the Supply and Demand Map. Values displayed in the workbench are totals across all mapped customer groups.
{% endhint %}

### Step 4: Set Up Partner Locations

Create locations representing where your partners hold inventory. These are the locations you will select in the workbench dropdown.

1. Go to Settings > Master Data > [Location Maintenance](/master-data/location-maintenance).
2. Create locations for each partner distribution point (e.g., "Partner A - East Warehouse", "Distributor B - Main DC").

{% hint style="info" %}
Partner locations represent where inventory is held at the partner/distributor, not your internal supply locations.
{% endhint %}

### Step 5: Link Items to Partner Locations

Create Item @ Location links for each item stocked at each partner location.

1. Go to Settings > Master Data > [Item @ Locations](/master-data/item-locations).
2. Create links between items and the partner locations where they are stocked.

{% hint style="info" %}
Only locations with Item @ Location links will appear in the workbench dropdown.
{% endhint %}

### Step 6: Configure the Supply and Demand Map

The Supply and Demand Map connects Item @ Customer Groups (demand) to Item @ Locations (supply). This tells the workbench which customer group demand data to use for each item at a partner location.

1. Go to Settings > Master Data > [Supply and Demand Map](/master-data/supply-and-demand-map).
2. For each item, create mappings that link the Item @ Customer Group to the Item @ Location at the partner.

For example, if "Chardonnay" is sold to customer group "West Coast Retailers" and stocked at "Partner A Warehouse", create a Supply and Demand Map entry linking the Chardonnay @ West Coast Retailers to Chardonnay @ Partner A Warehouse.

{% hint style="warning" %}
The Supply and Demand Map is required for the workbench to function. Items will only appear in the workbench grid if they have Supply and Demand Map entries linking their Item @ Customer Group to their Item @ Location at the selected partner.
{% endhint %}

### Step 7: Set Up Sale Types for Depletion

1. Go to Settings > Master Data > [Sale Types](/master-data/sale-types).
2. Create sale types for tracking partner depletion (e.g., "Partner Depletion", "Distributor Sales").

{% hint style="info" %}
Sale Types for depletion are assigned in your View configuration (Demand tab) to track how quickly partners are selling through inventory.
{% endhint %}

### Step 8: Set Up Sale Types for Shipments

1. Go to Settings > Master Data > [Sale Types](/master-data/sale-types).
2. Create sale types for tracking shipments to partners (e.g., "Partner Shipments", "Distributor Replenishment").

{% hint style="info" %}
Sale Types for shipments are assigned in your View configuration (Supply tab) to track inventory being sent to partners.
{% endhint %}

### Step 9: Import Partner Depletion Data

1. Go to Settings > Transactional Data > [Sales](/transactional-data/sales).
2. Import partner depletion data (forecasts and/or history).

### Step 10: Import Partner Inventory Data

1. Go to Settings > Transactional Data > [Inventory](/transactional-data/inventory).
2. Import current inventory levels at each partner location.

{% hint style="info" %}
Partner inventory levels are used to calculate Days on Hand and inform shipment recommendations.
{% endhint %}

### Step 11: Check Calendars (Optional)

1. Go to Settings > Master Data > [Calendars](/master-data/calendars).
2. Check existing setup to confirm Fiscal Years are in line with your requirements. Note changing calendars here will affect all areas of Claret.

{% hint style="info" %}
Calendars define fiscal periods for time-based planning. Select calendar-based time settings in your View to use these.
{% endhint %}

## Verifying Your Setup

Once you have completed the setup, verify everything is working:

1. Navigate to the Inventory Workbench - Partner.
2. Create a new View and select your Item Hierarchy Type and UOM.
3. Select a partner from the Location dropdown.
4. You should see items appear in the grid.

If no items appear or you see an empty state message, check the following:

* Verify Item @ Customer Group links exist for items sold to the selected partner.
* Verify Item @ Location links exist at your supply locations.
* Verify the Supply and Demand Map connects your supply locations to the partner customer group.


# Sales

Discover how to differentiate between various Sale Types, view sales data, and manage sales records with ease using our detailed walkthrough.

Within Claret, we store all sales data in one table called Sales. We identify the different types of sales data by something called [Sale Types](/master-data/sale-types). So, history, budget, forecasts, open sales orders, etc. are all stored together in this table and are differentiated by their type. In this guide we'll walk through reviewing the data, adding new sales records, updating existing sales records and deleting sales records.

{% hint style="info" %}
Before adding and viewing Sales data, you will need to define your [Sale Types](/master-data/sale-types)
{% endhint %}

### Navigate to the Sales page

1. Go to the navigation sidebar.
2. Click on "Settings" menu item.
3. Click on "Transactional Data" menu item.
4. Click on "Sales".

![](/files/-MkhLvBTTo9hUPnlTqMm)

### View Sales data

1. Choose a Sale Type from the Sale Type dropdown. This will show you all the sales data for the chosen Sale Type.

![Select a Sale Type, this will then display the Sales data for that Sale Type](/files/-MkhMd2XRbkqfBLPjcjQ)

![Table showing Sales data based on Sale Type chosen](/files/-MkhNIqx0AUPyvTvL6fH)

On the Sales page, you will notice the following pieces of data that make up a Sale row:

* Item along with the Item Description
* Customer Group along with the Customer Group Description
* The Sell Date and the Timing Interval it represents
* Quantity of the sale.

### Add a Sale row

1. Go to the "Options" button (the ellipses) in the top-right of the page and click on it.
2. Click on "Add".
3. In the tray that shows on the right side of the page, choose the "Item" for the Sale.
4. Then choose the "Customer Group" for this new Sale record.
5. Choose a "Sell Date" that this Sale represents. 👉 Be sure to choose a date that is going to represent the **start** of the "Timing Interval" that you'll be choosing next.
6. Type in the "Quantity" of the Sale.
7. Click on the "Save" button.

{% hint style="info" %}
In most cases when you're building a plan you'll be planning in months. Although we provide many Timing Intervals, you'll most likely choose "month". In some cases, you may choose "week".
{% endhint %}

{% hint style="info" %}
You can also enter your Sales records in bulk via our Sales import process. Instructions for how to import data can be found [here](/transactional-data/sales/sales-data-import). We also have a [Sales API](/api-guide/migration/sales-data) which allows you to provide sales data via API and can also discuss integrations.
{% endhint %}

![Adding a new Sale record](/files/-MkhQ9129jbHLMjJr_b8)

### Updating an existing Sale record

1. Click on the pencil icon next to the record you want to edit.
2. This will present the tray where you can update the "Sell Date", "Timing Interval" or the "Quantity"
3. Click on the "Save" button.

![Updating an existing Sale record in the tray](/files/-MkhRADbwvCO1e2sqEmp)

### Deleting an existing Sale record

1. Click on one or more checkboxes on the left-hand side of the Sale records.
2. Go to the "Options" button (the ellipses) in the top-right of the page and click on it.
3. Choose "Delete selected".
4. There will be a confirmation window that shows up. If you indeed want to delete the selected record(s), then enter 'DELETE' into the input box and select the Delete button.

<figure><img src="/files/YidHSGAQHouI9h4XgquS" alt="" width="375"><figcaption></figcaption></figure>


# Sales Data Import
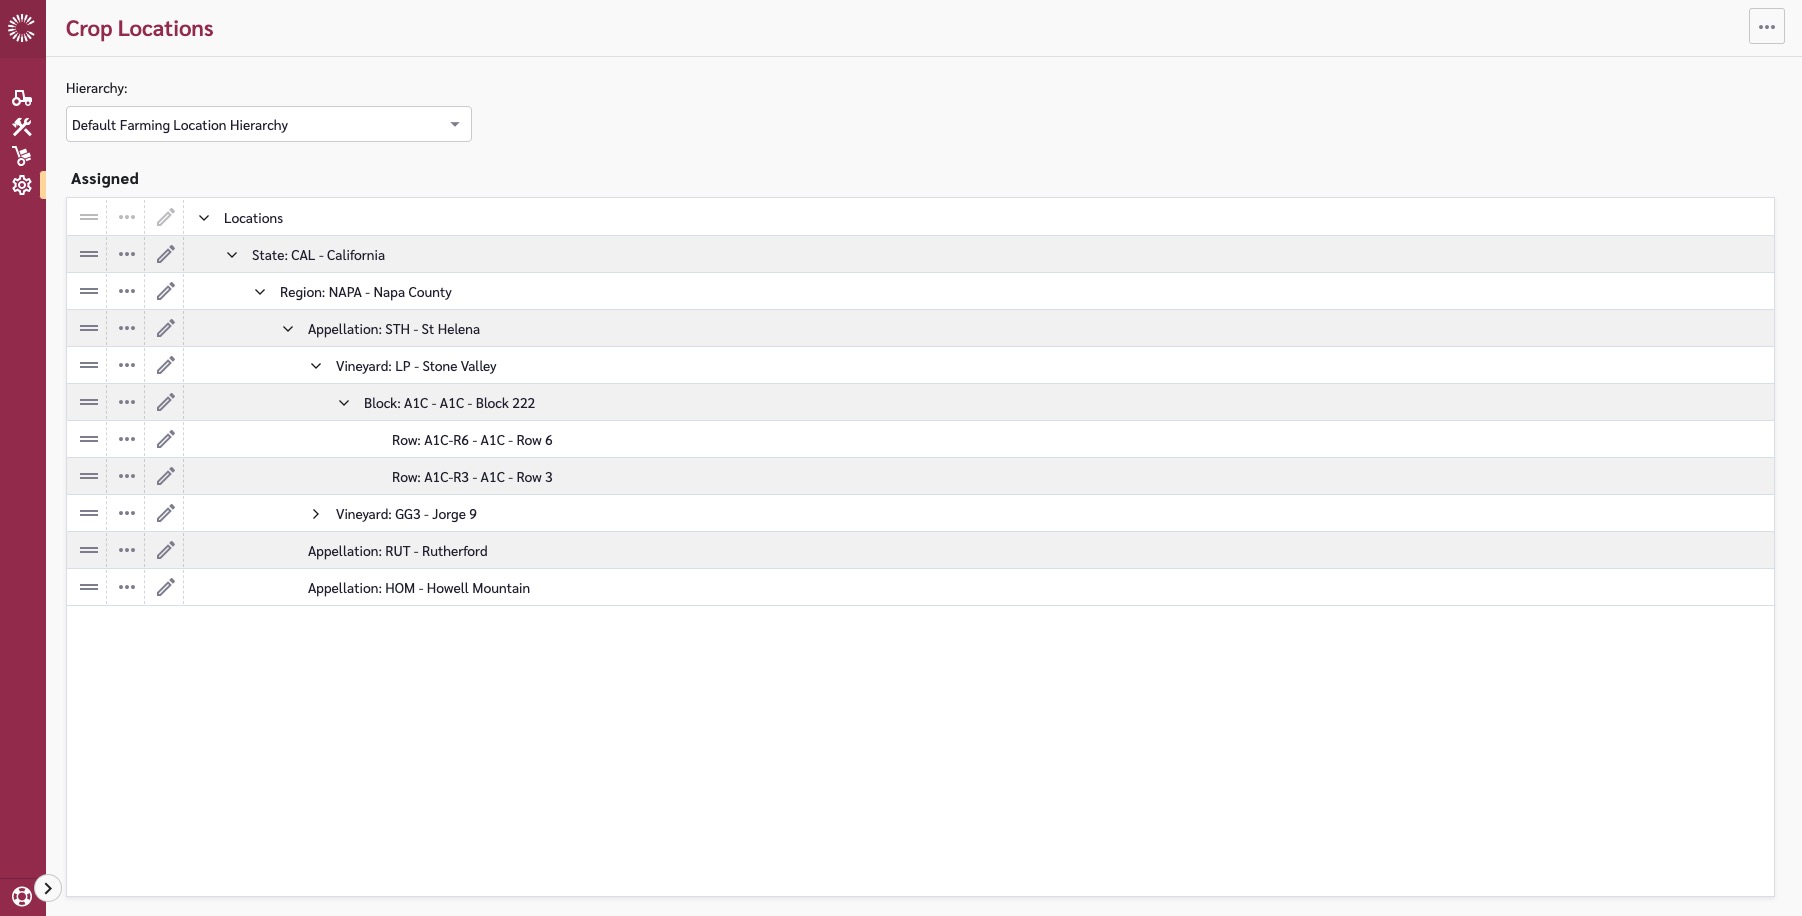
A step-by-step guide to efficiently upload sales data across multiple items and customer groups.

When entering Sales Data, both forecast and historical, there is often a need to load large amounts of data at once, across multiple [Items @ Customer Groups](/master-data/item-customer-groups). To do this efficiently, the Sales Data Import function can be used.

### Navigate to the Sales page

1. Go to the navigation sidebar.
2. Click on "Settings" menu item.
3. Click on "Transactional Data" menu item.
4. Click on "Sales".

![](/files/-MkhLvBTTo9hUPnlTqMm)

### Start the Import wizard

1. Go to the " Options" button (the ellipses) in the top-right of the page and click on it.

<figure><img src="/files/xel2KykWg5D7M9bvVhjo" alt="" width="223"><figcaption></figcaption></figure>

2. Click on "Import"
3. The "Import Sale Data" wizard will now open

<figure><img src="/files/Qy9irQd5jmD1qJ89aKLy" alt=""><figcaption></figcaption></figure>

There are 4 key steps in loading the data.

### **1.** Upload

Select the file that contains the Sales data to be loaded. The file can be dragged into the blue-bordered box, or select 'Browse your device' to browse to the file to be uploaded.

The key requirements for the file are that it be in .csv or .xlsx format, with a row for each Item @ Customer Group and time interval combination that you wish to load sales data for.

{% hint style="info" %}
**Note:** Sales data can only be loaded via the Import function at the Item @ Customer Group level.
{% endhint %}

Within the file to be loaded, the following data elements (columns) are required:

1. item - The item the sale relates to
2. customer\_group - The customer group the sale relates to. (The combination of item and customer group give the Item\@CustomerGroup)
3. sell\_date - The date the sale relates to
4. quantity - The quantity/amount sold/forecast to sell
5. sale\_type - The Sale Type that you wish to load the data against. For instance - if you wish to load the data against your 'Forecast FY' sale type then you would have a column containing that for each line item.
6. timing\_interval - The Timing Interval that the sale relates to (eg monthly sales, daily sales). Options are 'day', 'week', 'month', 'quarter', 'year'
7. uom - The unit of measure for the sale. Options are 'ton', 'gallon', 'Liter', 'Barrel', 9LE Case', 'Kilogram'

The following example file can be used as a base if required.

{% file src="/files/jvFFDrF2AjP5ssN0s2Px" %}
Example Sales Data upload file
{% endfile %}

Once the file has been loaded, select 'Next' at the bottom of the screen.

<figure><img src="/files/5EHVp6Mmas76pZwoCqkF" alt=""><figcaption></figcaption></figure>

### 2. Map Columns

After the file has uploaded, the mapping screen will be displayed. Here, you will map the columns in your uploaded file to the Sales fields in Claret. Each core Sales data element is displayed on the right, and the fields in the loaded file are available for you to select on the left.

<figure><img src="/files/lUsAHVnC6QWzMpwisfRt" alt=""><figcaption></figcaption></figure>

To map the fields, select the file column from the drop down next to each field.

<figure><img src="/files/wUhuYBR2dR7Xe4HsYkgH" alt=""><figcaption></figcaption></figure>

{% hint style="info" %}
Make sure you scroll down to map all fields
{% endhint %}

Once the required fields have been mapped, select 'Continue' to validate.

Once the Validation succeeds, click the 'Next' button at the bottom of the screen.

### 3. Configure

When importing Sales data, there are some configurations you can select to assist with ensuring the file processes. In the Configure step you will answer 3 questions.

<figure><img src="/files/t4Qcz2gMw0sOcz1q9ubZ" alt=""><figcaption></figcaption></figure>

How should we proceed if errors are found in the data?

* Halt Processing - this will stop the import if any error records are found
* Continue with Caution - this will log any errors but still import records that are error-free.

Should existing Sales by updated (or are we only creating new Sales)?

* Yes - if Sales records in the file contain the same Sale Type, Item, Customer Group, Sell date and Timing Interval as existing sales records, then the existing records will be updated
* No - any existing records will not be updated and only new unique records in the import file will be imported

Should required Item\@CustomerGroups that do not exist be created?

* Yes - If the import file contains Sales records for item and customer groups that do not have an existing item\@customergroup relationship, then the import process will automatically create these item\@customergroups.
* No - If the import file contains Sales records for item and customer groups that do not have an existing item\@customergroup relationship, then these records will not be imported.

Once you have confirmed your selections, select 'Next' at the bottom of the screen.

### 4. Import

Finally, confirm that you are ready to import the file. Select the 'Import' button at the bottom of the screen to proceed.

<figure><img src="/files/gRvJsIdaMP1rkRQJIcvo" alt=""><figcaption></figcaption></figure>

You will then be advised that the import has started. The confirmation will contain a link to the Job Management page where you can follow the progress of your import.

<figure><img src="/files/pvqI27WlE3YPp9jJV5pH" alt=""><figcaption></figcaption></figure>


# Bulk Copying Sales Data

Learn the step-by-step process of copying a set of sales data into another period or sales type using Claret's 'Copy into a Sale Type' function.

Sometimes, you may find you want to copy a set of sales data into another period, or into another sales type. For example:

* When planning for the next financial year, you may wish to copy last year's actual sales data into the next year's forecast.
* At the start of the financial year, you may wish to use the same set of numbers for Budget and Forecast (and then the forecast may be updated throughout the year).
* You may wish to use last year's forecast numbers again for this year.
* You may wish to create a 'Latest Estimate' and combine your sales to date with your future forecasts into a single Sale Type.

The 'Copy into a Sale Type' function can be used for scenarios such as these and many others.

To access this function, select the Options menu (ellipses) at the top of the 'Sales' page.

<figure><img src="/files/kScrS2D8McnnRLgQaZam" alt=""><figcaption></figcaption></figure>

After selecting the function, the Copy modal will be displayed.

<figure><img src="/files/sgxY47tvDEDQHQH4OvxU" alt=""><figcaption></figcaption></figure>

Here you will select the Sale Type you want to copy data from, and the sale type you would like to copy data to. Make selections as follows:

* *Choose 'Copy From' Sale Type -* the Sale Type that you will be copying data from. For example, if you wish to copy last year's sales history, you would select the sale type that contains your actual sales history.
  * *Start Date -* the start date for the data you wish to copy.
  * *End Date -* the end date of the data you wish to copy

Once you have selected one 'Sale Type', you will see an option to select another Sale Type. You can select a second here if you wish to combine two or more sale types.

<figure><img src="/files/QHo33l08VXPvjfScVP68" alt=""><figcaption></figcaption></figure>

{% hint style="info" %}
If you select more than one 'Copy From' Sale Type with overlapping start and end dates, any sales records which overlap will be added together in the 'Copy To' Sale Type.
{% endhint %}

* *Offset "from" Sales Type sell date -* check this if you wish to copy the data to a different set of dates than the original dates in the data. For example, if you are copying the data from last year to this year, then you would want to offset the data by 12 months. However if you are copying this year's budget to this year's forecast then you would not want to offset the dates.
  * *Timing Interval -* the type of time by which you wish to offset the dates (eg months or years).
  * *Number of Timing Intervals -* the number of timing intervals - eg if you selected years as your interval, and you only want to copy from last year to this year, then you would select '1' as your number of timing intervals to indicate 1 year.
* *Choose 'Copy To' Sale Type -* the Sale Type you wish to copy the data to. So if you are copying to your next year's forecast, you would select the sale type that is to contain your forecast data.

For example, if you wish to copy last financial year's history from April 1 to March 30 to this financial year's forecast, you would select the following:

<figure><img src="/files/FP6m5Z4szchxK84jNAJ7" alt=""><figcaption><p>Settings to Copy Sales Data</p></figcaption></figure>

When you make your selections, a summary of the 'From' data and resulting 'To' data is shown in an Overview before you confirm the Copy. If you have selected to offset dates you can also see the difference in the dates in the 'To' section.

<figure><img src="/files/in0OL6sLIisE5GdLanH4" alt=""><figcaption></figcaption></figure>

{% hint style="warning" %}
**ALL** data in the 'To' table will be replaced by the data you are copying, not only data in the selected range. The copy function will first delete all data in the 'To' table and then copy in the data from the 'From' table.
{% endhint %}

Once you have confirmed the data to be copied, select 'Copy'. You can now look at the 'To' Sales Types on the Sales page and see the new data.


# Supply Plans

Dive into our comprehensive guide on managing bulk wine, grape, and raw material supply plans, all differentiated by Supply Types. Learn to add, update, and delete records

Within Claret, we store all Supply Plans in one table. We identify the different types of supply plan data by something called Supply Types. So, bulk wine supply, grape supply and raw material supply are all stored together in this table and are differentiated by their type. In this guide, we'll walk through reviewing the data, adding new supply plan records, updating existing supply plan records and deleting supply plan records.

{% hint style="info" %}
Before adding and viewing Supply Plan data, you will need to define your [Supply Types](/master-data/supply-types)
{% endhint %}

### Navigate to the Supply Plans page

1. Go to the navigation sidebar.
2. Click on the "Settings" menu item.
3. Click on the "Transactional Data" menu item.
4. Click on "Supply Plans".

<figure><img src="/files/YfiFTrQEyXotXeOhzr02" alt=""><figcaption></figcaption></figure>

### View Supply Plan data

1. Choose a Supply Type from the Supply Type dropdown. This will show you all the supply plan data for the chosen Supply Type.

![](/files/uVEseB0qaCbWvwJF8bg4)

<figure><img src="/files/KojwMMHhDryKPU9ifQ0g" alt=""><figcaption></figcaption></figure>

On the Supply Plans page, you will notice the following pieces of data that make up a Supply Plan row:

* Item along with the Item Description
* Location - this will only be visible if the Supply Type you selected above has a category of 'item-locations'
* The Supply Date and the Timing Interval it represents
* Quantity to be supplied / that was supplied
* Supply Plan Status - this indicates how 'firm' the plan is

### Add a Supply Plan row

1. Go to the "Options" button (the ellipses) in the top-right of the page and click on it.
2. Click on "Add".
3. In the tray that shows on the right side of the page, choose the "Item" for the Supply Plan.
4. Then choose the "Location" for this new Supply Plan record if one is required.
5. Choose a "Date" that this Supply Plan represents. 👉 Be sure to choose a date that is going to represent the **start** of the "Timing Interval" that you'll be choosing next.
6. Type in the "Quantity" of the Supply Plan.
7. Click on the "Save" button.

{% hint style="info" %}
In most cases when you're building a plan you'll be planning in months. Although we provide many Timing Intervals, you'll most likely choose "month". In some cases, you may choose "week".
{% endhint %}

<figure><img src="/files/XFakmHXaOtNvjDTJczvL" alt=""><figcaption></figcaption></figure>

### Updating an existing Supply Plan record

1. Click on the pencil icon next to the record you want to edit.
2. This will present the tray where you can update the "Date", "Timing Interval", "Quantity," or "Supply plan status".
3. Click on the "Save" button.

<figure><img src="/files/ckwONtO0Y61VyzAZ3mOY" alt=""><figcaption></figcaption></figure>

### Deleting an existing Supply Plan record

1. Click on one or more checkboxes on the left-hand side of the Supply Plan records.
2. Go to the "Options" button (the ellipses) in the top-right of the page and click on it.
3. Choose "Delete selected".
4. There will be a confirmation window that shows up. If you indeed want to delete the selected record(s), then enter "DELETE".

<figure><img src="/files/86B3EYKZgK0tf2ZVQUDv" alt=""><figcaption></figcaption></figure>


# Supply Plan Data Import
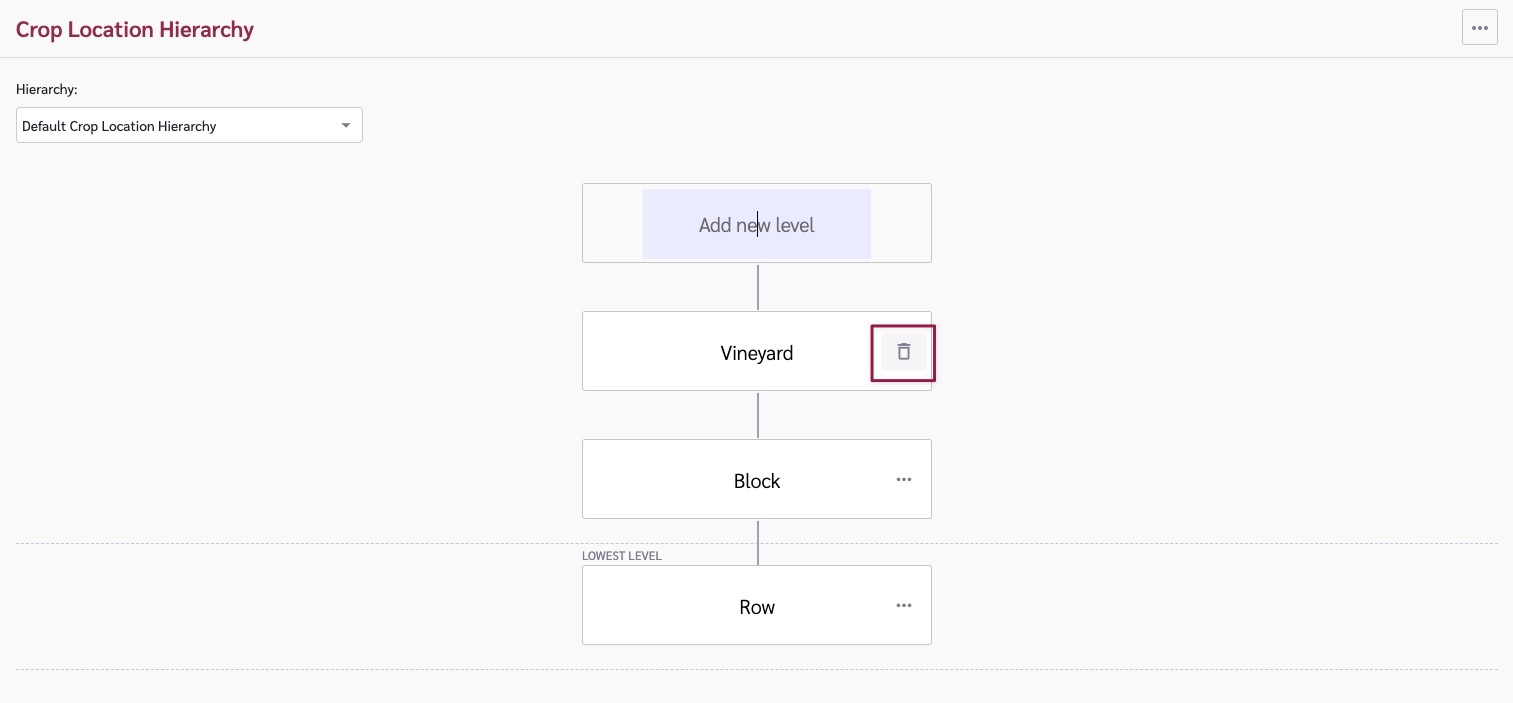
A step-by-step guide to efficiently upload supply plan data across multiple items or locations.

When entering Supply Plan data, there is sometimes a need to load large amounts of data at once, across multiple items or items and locations. To do this efficiently, the Supply Plan Import function can be used.

### Navigate to the Supply Plans page

1. Go to the navigation sidebar.
2. Click on the "Settings" menu item.
3. Click on the "Transactional Data" menu item.
4. Click on "Supply Plans".

<figure><img src="/files/YfiFTrQEyXotXeOhzr02" alt=""><figcaption></figcaption></figure>

### Start the Import wizard

1. Go to the " Options" button (the ellipses) in the top-right of the page and click on it.
2. Click on "Import"
3. The "Import Supply Plan Data" wizard will now open

<figure><img src="/files/AoUMF7cFAizySoZDZZWm" alt=""><figcaption></figcaption></figure>

Supply Plan data can be loaded in a csv or xlsx format.

There are 5 key steps in loading the data.

![](/files/wTzwrQHC0BSVoCRUxa5p)

### **1.** Choose

Select the file that contains the Supply Plan data to be loaded. The file can be dragged into the green-bordered box, or select 'Browse your device' to browse to the file to be uploaded.

The key requirements for the file are that it be in .csv or .xlsx format, with a row for each item or item\@location (depending on the category of the Supply Type) and the time interval combination that you wish to load supply plan data for.

{% hint style="info" %}
**Note:** Supply Plan data can be loaded at either the item level or item\@location level. Which you should use will depend on the Supply Type you are importing supply plans against. See [Supply Types](/master-data/supply-types) for further details.
{% endhint %}

Within the file to be loaded, the following data elements (columns) are required:

1. item - The item the supply plan relates to
2. location (optional) - This is required if the supply type you are loading data for has a category of 'items-locations'.
3. date - The date the supply plan relates to
4. quantity - The quantity/amount in the plan
5. supply\_type - The Supply Type that you wish to load the data against. For instance - if you wish to load the data against your 'Make Plan' supply type, then you would have a column containing that for each line item.
6. timing\_interval - The Timing Interval that the sale relates to (eg, monthly supply plan, daily supply plan). Options are 'day', 'week', 'month', 'quarter', 'year'
7. uom - The unit of measure for the supply plan. Options are 'ton', 'gallon', 'Liter', 'Barrel', 9LE Case', 'Kilogram'

The following example file can be used as a base if required.

{% file src="/files/s8NpJu8LHe8y1aMwpkuC" %}

### 2. Upload

Once the file has been selected, it will begin uploading automatically, and the upload indicator will be displayed.

<figure><img src="/files/ooj70pzqcW42GV5h60rf" alt=""><figcaption></figcaption></figure>

### 3. Map

After the file has been uploaded, the mapping screen will be displayed. Here, you can map the columns in your uploaded file to the Supply Plan fields in Claret. Each core Supply Plan data element is displayed on the right, and the fields in the loaded file are available for you to select on the left.

<figure><img src="/files/vAlzNIdJfd9ps1YQb3CG" alt=""><figcaption></figcaption></figure>

To map the fields, you can now select the file column from the drop down next to each field.

<figure><img src="/files/tATIFU0ro9ktuE0ZKOUm" alt=""><figcaption></figcaption></figure>

{% hint style="info" %}
Make sure you scroll down to map all fields
{% endhint %}

Once the required fields have been mapped, select 'Continue' to validate.

### 4. Validate

The data is then validated against the Supply Plan import rules. The next step will depend on how many rows with errors are found during validation.

**Less than 100 rows with errors**

If there are less than 100 rows with validation errors in the imported file, then any data that does not meet the validation rules will be displayed in a table and highlighted in red.

In this example, you can see the UOM can not be found in Claret (because it should be Gallon rather than Gallons) and one of the items cannot be found.

<figure><img src="/files/ITXJjqRDsd7qWcmumxPd" alt=""><figcaption></figcaption></figure>

To resolve the errors, the data can be edited inline by clicking in the required cell. (**Note:** if there are a large number of validation issues you may wish to resolve them in the base file and re-upload.) Or, in the case of an error like the above, where an item cannot be found, you may need to go back and set up or check Items or Item\@Locations in Claret.

Once a change has been made, the data can be validated again by selecting the 'Validate' button in the bottom right. Rows that now pass will be removed from the view.

Once all data passes validation, the 'Import' button will be enabled.

Select 'Import' and the data will import and now be available to view in Claret.

**More than 100 rows with errors**

If there are more than 100 rows in the file with errors, then an error file will be available for you to download. You can download this by clicking 'Download Errors File' and you will then be able to see the errors within the rows that had validation issues.

If there are rows that passed validation, you will be given the option to continue importing these rows.

<figure><img src="/files/BUuDrn5FWEyQ6nKIveeK" alt=""><figcaption></figcaption></figure>

Selecting 'Continue with Import' will then enable the Import button at the bottom of the screen and you can click this to import the rows without errors.


# Bulk Copying Supply Plan Data
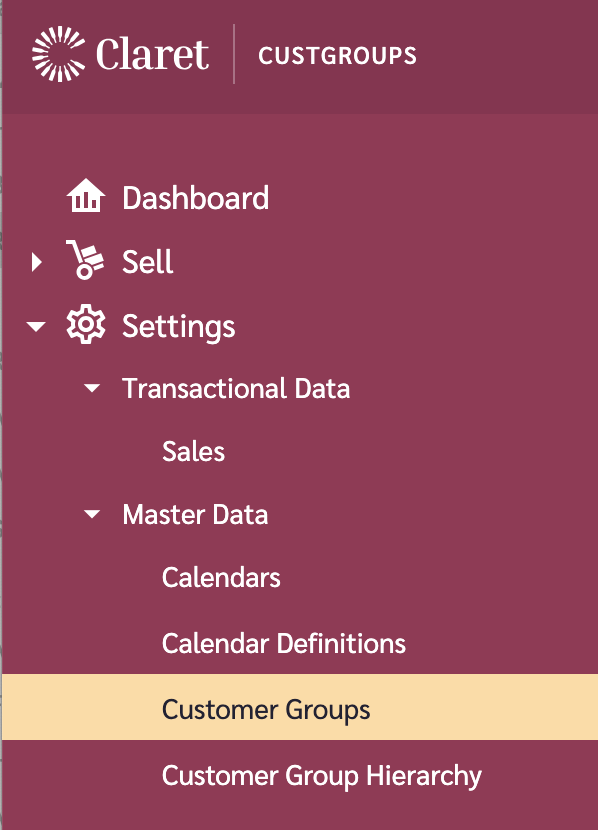
Discover how to use Claret's 'Copy into a Supply Type' function for various scenarios, such as planning for the next financial year or creating different supply scenarios.

Sometimes, you may find you want to copy a set of supply plan data into another period, or into another supply type. For example:

* When planning for the next financial year, you may wish to copy last year's planned supply data into the next year's plan.
* When using the Make Planning module, you may wish to have a base 'Make Plan' that you use as your 'official' plan, but then have some working scenarios that you use to look at what different supply numbers do to your plans. To facilitate this you can copy the base into another supply type.

The 'Copy into a Supply Type' function can be used for scenarios such as these and many others.

To access this function, select the Options menu (ellipses) at the top of the 'Supply Plans' page.

<figure><img src="/files/ZJZXZo1D7HrayAognKlu" alt=""><figcaption></figcaption></figure>

After selecting the function, the Copy modal will be displayed.

<figure><img src="/files/Bp6j9WYdzOfzuX4MUk3q" alt=""><figcaption></figcaption></figure>

Here you will select the Supply Type you want to copy data from, and the Supply Type you would like to copy data to. Make selections as follows:

* *Copy From Supply Type -* the Supply Type that you will be copying data from. For example, if you wish to copy last year's Make Plan you would select the 'Supply Type' containing this data. You can select more than one Supply Type to copy data from - the values per time period will be added. A new row will appear after you select a supply type if you wish to add more.
  * *Start Date -* the start date for the data you wish to copy
  * *End Date -* the end date of the data you wish to copy
* *Offset "from" Supply Type date -* check this if you wish to copy the data to a different set of dates than the original dates in the data. For example, if you are copying the data from last year to this year, then you would want to offset the data by 12 months. However if you are copying this year's Make Plan to a copy to play around with then you would not want to offset the dates.
  * *Timing Interval -* the type of time by which you wish to offset the dates (eg months or years).
  * *Number of Timing Intervals -* the number of timing intervals - eg if you selected years as your interval, and you only want to copy from last year to this year, then you would select '1' as your number of timing intervals to indicate 1 year.
* *Copy To* - the Supply Type you wish to copy the data too. (If you are copying to a new supply type then you will need to go to the Supply Types page first to create the supply type so it can be selected here).

So, if you wish to copy last year's Make Plan from 2017 to 2024, you would select the following:

<figure><img src="/files/PEhEjfSPBTp4kAUsmiB3" alt=""><figcaption></figcaption></figure>

When you make your selections, the data being copied *From* and *To* is shown in the table at the bottom of the view so you can validate that what you wish to occur is what will occur.

Once you have confirmed the data to be copied, select 'Copy' You can now look at the 'To' table in the Supply Plans view and see the new data.


# Inventory

Manage your inventory with Claret. Understand the key pieces of data in an inventory row, and follow the steps to add, update, or delete inventory records efficiently.

Inventory figures feed into multiple areas within Claret. You can track inventory of any type of item in order to understand your position at any point in time.

### Navigate to the Inventory page

1. Go to the navigation sidebar.
2. Click on the "Settings" menu item.
3. Click on the "Transactional Data" menu item.
4. Click on "Inventory".

<figure><img src="/files/O1Y2lwQb8q4lqycb1b2F" alt=""><figcaption></figcaption></figure>

### View Inventory data

Any existing Inventory records will be displayed when the page loads.

<figure><img src="/files/lWF9BDoZ4psfPhTFty8i" alt=""><figcaption></figcaption></figure>

On the Inventory page, you will notice the following pieces of data that make up an Inventory row:

* Item along with the Item Description
* Location, Location Area and Bin (where the inventory sits either physically or logically)
* Lot - any lot information for the inventory - this can be generic if required
* The Supply Date and the Timing Interval it represents
* The Material Status - by default the options are FG (finished good) or WIP (work in process). If you have other status types you wish to track then please contact the support team have these created.
* Date Filled - when the inventory was put in place
* Quantity and UOM

### Add an Inventory row

1. Go to the "Options" button (the ellipses) in the top-right of the page and click on it.
2. Click on "Add".
3. In the tray that shows on the right side of the page, choose the "Item" for the Inventory record.
4. Then choose the "Location", "Location Area" and "Bin". (The options in each subsequent field will narrow depending on your choice above).
5. In the "Lot" field, either select an existing Lot or select "Create New Lot" to add a new lot.
6. Choose the material status.
7. Choose the "Date Filled".
8. Type in the "Quantity" of Inventory and select the "UOM".
9. Click on the "Save" button.

<figure><img src="/files/ijOjdzaHWIXfx2QwqxIE" alt=""><figcaption></figcaption></figure>

### Updating an existing Inventory record

1. Click on the pencil icon next to the record you want to edit.
2. This will present the tray where you can update any details against the record.
3. Click on the "Save" button.

### Deleting an existing Inventory record

1. Click on one or more checkboxes on the left-hand side of the Inventory records.
2. Go to the "Options" button (the ellipses) in the top-right of the page and click on it.
3. Choose "Delete selected".
4. There will be a confirmation window that shows up. If you indeed want to delete the selected record(s), then enter "DELETE".

<figure><img src="/files/nFqlMwABZw2BOuahOk6F" alt=""><figcaption></figcaption></figure>


# Inventory Import

Load your inventory via this import approach

The ability to import inventory is currently in development and will be available before end October 2023.

To import Inventory in the meantime, please provide to our support team a file using the below template and this will be loaded straight in.

{% file src="/files/x4dDDaeKziZRtKVUjrmp" %}


# Exporting Data

Easily export all your transactional data for sales and inventory into a CSV format with Claret App.

Transactional data is able to be exported into a csv format.

The Export function can be accessed via the Options (...) menu on the following pages:

* **Transactional Data > Sales**

![](/files/l3adeIzqIfVmKtVOge2J)

* **Transactional Data > Inventory**

![](/files/jIW0dqJqKOXtwjcE9p33)

Selecting the 'Export' option will download a csv file locally.

{% hint style="info" %}
The location of your downloaded file will depend on the settings of the machine you are using to access Claret. In most cases, the file will be saved in your machines 'Downloads' folder.
{% endhint %}


# Calendars

Set up and manage Calendars and Calendar Definitions to control how time-related data is grouped and reported across Claret modules.

Aggregating data across quarters, half years, financial years and other groups of months is a key function within Claret. In order to cater for the ways different companies and regions report, there is the ability to create Calendars.

Calendars are managed on the **Master Data > Calendars** page, which has two tabs: **Calendars** and **Calendar Definitions**.

## Calendar Definitions

Calendar definitions are templates that describe how you want to group time-related data. For example, if you wish to report across financial years, you would create an FY calendar definition. There are some calendar definitions created by default but you can update these to meet your requirements.

Calendar definitions are managed on the **Calendar Definitions** tab of the Calendars page.

<figure><img src="/files/YPAX4fRFxqMFt3TqEjbI" alt=""><figcaption></figcaption></figure>

A Calendar Definition has a:

* **Name** — used to refer to and select the definition in other areas of the app
* **Parent** — indicates whether this calendar definition rolls up into another definition (optional)
* **Timing interval** — together with the interval quantity, shows what the calendar definition represents

For example, an FY calendar definition with no parent and a duration of 1 year could have H1 and H2 child definitions, each 6 months long. This represents that a Financial Year is made up of two Half Years.

To add a new Calendar Definition, select the options (ellipses) menu and then select **Add Calendar Definition**. Enter the definition data and then select **Save**.

<figure><img src="/files/8ZTA1cXhIiWXCi3KN2bO" alt=""><figcaption></figcaption></figure>

To edit a Calendar Definition, click the pencil icon beside the corresponding row, edit the details, and select **Save**.

{% hint style="info" %}
Set up your calendar definitions before creating calendars — the definitions are used to automatically generate time buckets when you create a calendar.
{% endhint %}

## Calendars

Calendars are instances that apply your calendar definitions across a specific date range. Each calendar generates a set of **time buckets** — the individual date ranges used for planning and reporting.

Calendars are managed on the **Calendars** tab of the Calendars page.

<figure><img src="/files/4TURzwjr9jz6WD21Mf4M" alt=""><figcaption></figcaption></figure>

### Creating a Calendar

To create a Calendar, select the options (ellipses) menu and select **Add calendar**.

A modal appears where you enter:

* **Calendar name** — for example, FY26
* **Start Date** — the first day of the calendar period
* **End Date** — the last day of the calendar period

As soon as both dates are set, a **Calendar Definition Assignment Preview** appears automatically. This shows the time buckets that will be generated based on your calendar definitions and the date range you've entered.

<figure><img src="/files/kYHYmGJzRSskN8N764E8" alt="Calendar creation modal showing the Calendar Definition Assignment Preview"><figcaption></figcaption></figure>

In the preview you can:

* **Toggle** individual time buckets on or off using the checkbox for each row
* **Adjust start and end dates** for individual buckets if needed
* Review parent-child relationships between definitions

Once you are happy with the preview, select **Create Calendar**. The calendar and all selected time buckets are created in a single step.

### Generating Time Buckets for an Existing Calendar

If a calendar was created without time buckets, or you have added new calendar definitions since the calendar was created, you can generate time buckets from the options menu.

Select the calendar from the dropdown, then open the options (ellipses) menu and select **Generate time buckets**. This automatically creates time buckets for all calendar definitions across the calendar's date range.

{% hint style="info" %}
The **Generate time buckets** option only appears in the options menu when the selected calendar has no time buckets.
{% endhint %}

### Adding an Individual Definition

You can also add a single calendar definition to an existing calendar manually. Select the calendar from the dropdown, open the options menu and select **Add calendar definition to \[calendar name]**. Select the definition and set the start and end dates, then click **Add**.

### Viewing and Editing a Calendar

Select a calendar from the dropdown on the Calendars tab to view its time buckets in the grid. Each row shows the definition name, parent, timing interval, and start and end dates.

Dates against a definition can be changed by clicking the date in the grid and entering a new value.

The calendar's overall start and end dates are shown above the grid and can be edited directly. If you update these dates and click **Save**, the app will ask whether you want to regenerate the time buckets for the updated date range.

### Renaming a Calendar

Open the options menu and select **Edit calendar** while the calendar is selected. Update the name and select **Save**.

### Deleting a Calendar

Open the options menu and select **Delete calendar** while the calendar is selected. Note that this will also delete all associated time buckets.


# Crop Locations

Step-by-step guide on creating and managing crop locations in Claret App. Discover how to build your hierarchy from the topmost levels down to child locations.

If you are using the Claret Farm module, you will need to set up your Crop Locations and Crop Items.

Crop Locations and Crop Items are used to track the raw materials, and their source locations, that go into your [work in process](/master-data/items/work-in-process-aged-items) and [finished good](/master-data/items/finished-goods-items) items.

### Crop Locations

Crop Locations are used to manage the physical geographical structure of raw material crops (for example, grapes) and crop requirements. The hierarchy works in the same way as your Item and Customer Group Hierarchies, which we set up earlier.

The first thing you will need to decide is how you want to manage your crops. You can plan all the way down to row level, or at a higher level if you wish.

Let's start by looking at an example. In this example we are using Rows and Blocks beneath the Vineyard level to break down grape supply and then rolling up to Appellation, Region and State.

Based on these Crop Location Hierarchy levels, we'll create a Crop Location hierarchy for our fictitous company, "ZymOeno".

{% hint style="info" %}
You will need to start with creating your [Crop Location Hierarchy](/master-data/crop-location-hierarchy) before adding the actual locations.
{% endhint %}

<figure><img src="/files/UoO6xfC2GGC4iyoNUfO8" alt=""><figcaption></figcaption></figure>

The Crop Locations we will set up are:

<figure><img src="/files/uGVj2s5w8O2RdJg1MzxQ" alt=""><figcaption></figcaption></figure>

To start adding your Crop Locations,

### Navigate to the Crop Locations page

1. Go to the navigation sidebar.
2. Click on "Settings" menu item.
3. Click on "Master Data" menu item.
4. Click on "Crop Locations".

<figure><img src="/files/D9FwjnIwTlr9Y4FPKowL" alt=""><figcaption></figcaption></figure>

### Add first Crop Location

{% hint style="info" %}
When you're first building out your hierarchy, it will make things a little easier if you start with the topmost levels of your hierarchy. That's why we are starting with the "State" level we created in our [Crop Location Hierarchy](/master-data/crop-location-hierarchy). You can start at any level and move things around, but this is just a tip.
{% endhint %}

#### Create the crop location

1. Go to the "Options" (ellipses) button in the top-right of the page and click on it.
2. Click on "Add unassigned Location".
3. A tray will slide in from the right. This is where you'll be adding the details about the crop location.
4. Enter the "Name" of your location (often an id - this must be unique).
5. Enter the "Description" of your location.
6. Click on the "Save" button.
7. Next to the word "Assigned", you'll notice a link to view "Unassigned".
8. The 'Unassigned' section of the screen will now appear and your newly created crop location will be visible.

<figure><img src="/files/MIGIZymhSyzNFrmnTfGf" alt=""><figcaption></figcaption></figure>

{% hint style="info" %}
You will see some default crop locations in your hierarchy. These are created as placeholders when you first create the hierarchy. You can either delete them when you have some of your actual locations created or edit them to include in your setup.
{% endhint %}

#### Assign the crop location

1. Drag the newly created Crop Location from the "Unassigned" section to the "Assigned" section. Drop it on the row that has "Locations" spelled out.
2. You'll notice that it is assigned to the "State" level, which is the topmost level that we created in the Crop Location Hierarchy.

<figure><img src="/files/HNaGyzdWkv1ib4A9jlDI" alt=""><figcaption></figcaption></figure>

#### Adding more crop locations

You can continue to create new crop locations as we did above. Or, you can create them from the perspective of the crop location you just created. Let's create another "State" crop location.

1. Click on the ellipsis button to the left of the newly created and assigned crop location.
2. Click on the "Add another State"
3. This will show the tray again and this is where you can create this new crop location.
4. By doing it this way, you are creating the crop location and assigning it at once.

<figure><img src="/files/kSR7mX8SiAdH1IFZzhUR" alt=""><figcaption></figcaption></figure>

Let's add a child crop location under the "California" state we created.

1. Click on the ellipsis button to the left of the newly created and assigned state.
2. Click on the "Add Region under this State".
3. Create the crop location by entering in the "Name" and the "Description".

<figure><img src="/files/aRn7pC1uqpoy2ILUlLbC" alt=""><figcaption></figcaption></figure>

Now we have a couple of levels of our Crop Locations built out. We can continue with these steps to build out the rest of the Crop Locations we need.

<figure><img src="/files/7uonfX8PQUhiBfHY4JSx" alt=""><figcaption></figcaption></figure>

Crop Locations can also be re-ordered and moved around the hierarchy using the drag and drop feature.

<figure><img src="/files/HNaGyzdWkv1ib4A9jlDI" alt=""><figcaption></figcaption></figure>

### Importing Crop Locations

If you have a large number of crop locations to create, we can import all your crop locations for you. To do this, we will need a .csv or .xlsx sheet containing your crop locations. The sheet will again need a column for each level of your hierarchy, with a name and description each time.

Here is an example sheet using our example from above. You can copy this and change the header rows to match the hierarchy you built earlier. (For example, if you don't have a State level, you would delete these columns, or if your levels are named differently you would replace the levels in row 1 of the template).

{% file src="/files/KY9FFT1iR5YdeEnEC3Ol" %}


# Crop Location Hierarchy

Design your Crop Location Hierarchy. This guide offers step-by-step instructions for updating, adding, and deleting hierarchy levels to manage your crops.

### Navigate to the Crop Location Hierarchy page

1. Go to the navigation sidebar.
2. Click on the "Settings" menu item.
3. Click on the "Master Data" menu item.
4. Click on "Crop Location Hierarchy".

<figure><img src="/files/7THm4CABJipwUFICnIc2" alt=""><figcaption></figcaption></figure>

### Update the name of an initial lowest level

1. Click on the name of a level.
2. This will turn the text into an input box where you can update the name.
3. Make your update.
4. To save your update, simply click outside of the hierarchy-level rectangle you're updating.

<figure><img src="/files/llXUeeZcOM6TnX02Db17" alt=""><figcaption></figcaption></figure>

### Adding your first new level

When you're first creating a hierarchy, you will be provided the initial lowest level. When you want to add a new level, you'll be able to add a parent to this initial lowest level.

To do this, click into the "Add new level" rectangle and begin typing the name of the level.

<figure><img src="/files/YLBw4sqtQNKyQgNx3bgE" alt=""><figcaption></figcaption></figure>

Continue building out the hierarchy adding the levels you require.

### Deleting a level

You can only delete the topmost level in the hierarchy. You do this by clicking on the delete icon (trashcan) on the right-hand side of the level.

<figure><img src="/files/2eGtKa5GIJ3QM9NL6Qbn" alt=""><figcaption></figcaption></figure>

{% hint style="warning" %}
When adding or deleting levels, any items you have set up will be affected. If you have any questions relating to the impact of adding or deleting hierarchy levels once you have all your items in place, then contact Claret support to talk through your requirements.
{% endhint %}

{% hint style="info" %}
Once you have built your hierarchy, you are ready to add specific crop locations. See [Crop Locations](/master-data/crop-locations)
{% endhint %}


# Customer Groups

Maximize flexibility and control in managing your customers with the Claret App. This guide provides instructions on creating and organizing your Customer Groups within the Customer Group Hierarchy.

A key component within Claret is the customers that you sell your products to. We use Customer Groups to manage this information.

What we will do in this guide is walk you through how you would create a set of Customer Groups that represent different levels in your Customer Group hierarchy. Once you go through these steps, you'll be able to add new Customer Groups at any level, make updates and remove Customer Groups.

Based on the below Customer Group Hierarchy levels, we'll create a Customer Group hierarchy for our fictitous company, "ZymOeno".

{% hint style="info" %}
It is recommended that you start with creating your [Customer Group Hierarchy](/master-data/customer-group-hierarchy) before adding Customer Groups.
{% endhint %}

![](/files/-MjH417UW3KukoGmeOwy)

Here's the hierarchy that we'll build out

* East
  * Florida
    * Palm Tree Distribution
    * Sol Family Distributors
    * Rubix, Inc.
  * Illinois
    * Chi-town Distribution
    * Lakeside, Co.
    * Elevated Wine and Spirits
  * New York
    * Broadway Wholesalers
    * I ❤️ NY Distribution, Co.
    * Satriale's Beer & Wine
* West
  * Arizona
    * Greater AZ Wholesalers
    * Trust Inoculum Wine & Beer
  * California
    * Left Coast Distributor, Inc
    * Los Surf Wine Merchants
    * To the Bay Wine Sellers
  * Texas
    * SRV Beer & Wine, Inc.
    * Big Distributors
    * Alamo Wholesalers

### Navigate to the Customer Groups page

1. Go to the navigation sidebar.
2. Click on "Settings" menu item.
3. Click on "Master Data" menu item.
4. Click on "Customer Groups".

<figure><img src="/files/JVRMtmfNhoDcRQlRsMlD" alt="" width="299"><figcaption><p>Master Data Menu</p></figcaption></figure>

### Understanding the Customer Groups page

The Customer Groups page is separated into 2 sections. The left-hand panel contains the Customer Group Hierarchy and Customer Groups we are working with. The right-hand panel contains all the Customer Groups we can add to the Hierarchy on the left.

### Select the hierarchy you are working with

Within Claret it is possible to have different customer group hierarchies. Before adding or managing customer groups, in the left hand panel, select the hierarchy from the drop down

<figure><img src="/files/5oTG14O5sjW8giyEDpXB" alt=""><figcaption><p>Select the Hierarchy</p></figcaption></figure>

{% hint style="info" %}
You will see some default customer groups in your hierarchy. These are created as placeholders when you first create the hierarchy. You can either delete them when you have some of your actual customer groups created or edit them to include in your setup.
{% endhint %}

### Add first Customer Group for the "Division" level

{% hint style="info" %}
When you're first building out your hierarchy, it will make things a little easier if you start with the topmost levels of your hierarchy. That's why we are starting with the "Division" level we created in our Customer Group Hierarchy. You can start at any level and move things around, but this is just a tip.
{% endhint %}

#### Create the customer group

1. Go to the "Options" (ellipses) button in the top-right of the page and click on it.
2. Click on "Add unassigned Customer Group".

<figure><img src="/files/RHIIaX4GKV9tsbinu3vH" alt=""><figcaption></figcaption></figure>

3. A tray will slide in from the right. This is where you'll be adding the details about the customer group.
4. Enter the "Name" of your customer group.
5. Enter the "Description" of your customer group.
6. Click on "Save" button.

<figure><img src="/files/Z8k0Tk3bLfCJY2ne5lmC" alt=""><figcaption></figcaption></figure>

7\. The new Customer Group will appear on the right hand size in the 'Unassigned' panel.

<figure><img src="/files/1fKQ1vX1zckdc4a7xOgq" alt=""><figcaption></figcaption></figure>

#### Assign the customer group

1. Drag the newly created Customer Group from the "Unassigned" section to the "Assigned" section. Drop it on the row that has "Customer Groups" spelled out.
2. You'll notice that it is assigned to the "Division" level, which is the topmost level that we created in the Customer Group Hierarchy.

<figure><img src="/files/H7mLqG70bvDAE6vqeLKU" alt=""><figcaption></figcaption></figure>

#### Adding more customer groups

You can continue to create new customer groups as we did above. Or, you can create them from the perspective of the customer group you just created. Let's create another "Division" customer group.

1. Click on the ellipsis button to the left of the newly created and assigned 'East' customer group.
2. Click on the "Add another Division"
3. This will show the tray again and this is where you can create this new customer group.
4. By doing it this way, you are creating the customer group and assigning it at once.

<figure><img src="/files/uBCEln0SFTN0l2IyIZ6c" alt=""><figcaption></figcaption></figure>

Let's add a child customer group under the "East" division we created.

1. Click on the ellipsis button to the left of the newly created and assigned "East" division.
2. Click on the "Add State under this Division".

<figure><img src="/files/9fXZkQ1Tu3b4CBrSwaO0" alt=""><figcaption></figcaption></figure>

3. Create the customer group by entering in the "Name" and the "Description". In this example we are using 'FL' as the name and 'Florida' as the description.
4. Once saved, you will see the State appear directly beneath the Division you created it under.

<figure><img src="/files/j3X6WpcI74HFfXkIQuDX" alt=""><figcaption></figcaption></figure>

Now we have a couple of levels of our Customer Groups hierarchy built out. We can continue with these steps to build out the rest of the Customer Groups.

<figure><img src="/files/LS0oYEAZnAJAo4Q45MxW" alt="" width="375"><figcaption></figcaption></figure>

Customer Groups can also be re-ordered and moved around the hierarchy using the drag and drop feature

<figure><img src="/files/lm7PJRsLsdSYzr5eTsgp" alt="" width="476"><figcaption></figcaption></figure>

If you have a large number of Customer Groups you wish to create, we can import these for you. To do this, we will need a .csv sheet containing your customer groups. The sheet will need a column for each level of your hierarchy, with a name and description each time.

Here is an example sheet using our example from above. You can copy this and change the header rows to match your Customer Group hierarchy.

{% file src="/files/AsZQ6OJzZvbbigzYH7ms" %}

2.


# Customer Group Hierarchy

Customize your Customer Group Hierarchy structure. Learn how to add and organize customer group levels to match your planning needs.

When managing Sales data within Claret, a key data element is who you sell to. In order to define this, we begin with a Customer Group hierarchy. This allows you to structure your customers in whichever way makes sense for your business.

To build out your customer group hierarchy:

### Navigate to the Customer Group Hierarchy page

1. Go to the navigation sidebar.
2. Click on "Settings" menu item.
3. Click on "Master Data" menu item.
4. Click on "Customer Group Hierarchy".

<figure><img src="/files/sMmrRYPxGAhiCOvy6mhM" alt=""><figcaption></figcaption></figure>

If this is the first hierarchy you are creating, you will be able to select the 'Create hierarchy type' button on the main screen. Otherwise, go to the Options (...) menu and select 'Add Customer Group Hierarchy.

<figure><img src="/files/Ejn2AmWG4UGuXi6bKsHD" alt=""><figcaption><p>Adding a new Customer Group Hierarchy</p></figcaption></figure>

Give your hierarchy a name and description and select Save. Your hierarchy will then be created with an initial lowest level.

### Update the name of the initial lowest level

1. Click on the name of a level.
2. This will turn the text into an input box where you can update the name.
3. Make your update.
4. To save your update, simply click outside of the hierarchy-level rectangle you're updating.

![](/files/-MiXOLXD1bMOv6jAChkZ)

### Adding your first new level

When you're first creating a hierarchy, you will be provided the initial lowest level. When you want to add a new level, you'll be able to add a parent to this initial lowest level

1. Click into the "Add new level" rectangle and begin typing the name of the level.

![](/files/-MiXOaeibtPQfg5leu8d)

### Deleting a level

You can only delete the top most level in the hierarchy. You do this by clicking on the delete icon (trashcan) on the right-hand side of the level.

![](/files/-MiXSeV9m2iSCXigWqUD)

{% hint style="warning" %}
When adding or deleting rows, any customer groups you have set up will be affected. If you have any questions relating to the impact of adding or deleting hierarchy levels once you have all your customer groups in place, then contact Claret support to talk through your requirement
{% endhint %}


# Items

Claret App makes creating items for different hierarchies easy. Use our guide to learn how to build out item hierarchies for finished goods, work in process (WIP), and raw materials/crop items.

In Claret, Items represent finite planning items that are used during your product lifecycle.

There are 3 different types of Items.

1. Finished Goods - these are the items you sell
2. Work in Process - these are the items that form ingredients for your finished goods. For example, in the wine industry, these items would be the bulk wine that is then bottled into your finished good items.
3. Raw Materials - these are the items you begin with. These will be inputs into your Work in Process and Finished Goods items. For example, in winemaking, one raw material would be grapes.

{% hint style="info" %}
Before you create your Items you will need to set up your [Item Hierarchy](/master-data/item-hierarchy) for each item type.
{% endhint %}

What we will do in this guide is walk you through how you would create a set of items that represent different levels in your Finished Good Item hierarchy. Once you go through these steps, you'll be able to add new items at any level, make updates and remove items.

Before we get started, let's take a look at the 'Items' page.

### Navigate to the Items page

1. Go to the navigation sidebar.
2. Click on "Settings" menu item.
3. Click on "Master Data" menu item.
4. Click on "Items".

<figure><img src="/files/Ac0JsGYuEH6lhEXwpbKK" alt="" width="282"><figcaption></figcaption></figure>

When you first visit the page, you will notice that you can select any of the different hierarchies that you have defined and manage the items within these hierarchies from this page. This means Finished Goods items, Work in Process (WIP) items, and Raw Materials/Crop items can all be managed here.

<figure><img src="/files/wFvAt7aDMIyGQzdcI0LT" alt=""><figcaption></figcaption></figure>

To work through how items are managed, we will use a Finished Goods example, however the steps to build out your items are the same for your other hierarchy types.

Based on the below Finished Good Item Hierarchy levels, we'll create an item hierarchy for our fictitious company, "ZymOeno".

{% hint style="warning" %}
You will need to start with creating your [Item Hierarchy](/master-data/item-hierarchy) before adding Finished Good Items.
{% endhint %}

Here's the hierarchy that we'll build out

<figure><img src="/files/ZZH5cvi8st1vAdoRDHke" alt=""><figcaption></figcaption></figure>

* Premium
  * ZAM
    * ZAM Napa Valley Cabernet Sauvignon 12 x 750ml
    * ZAM Sonoma Coast Chardonnay 12 x 750ml
    * ZAM Lodi Zinfandel 12 x 750ml
  * Noble Science
    * NSC North Coast Pinot Noir 12 x 750ml
    * NSC North Coast Cabernet Sauvignon 12 x 750ml
    * NSC North Coast Merlot 12 x 750ml
  * Clairemont
    * CLM Central Coast Pinot Noir 12 x 750ml
    * CLM Central Coast Sangiovese 12 x 750ml
    * CLM Central Coast White Blend 12 x 750ml
* Luxury
  * Fine
    * FNE St Lucia Hills Pinot Noir 12 x 750ml
    * FNE St Lucia Hills Chardonnay 12 x 750ml
  * Prestige
    * PRS Russian River Syrah 12 x 750ml
    * PRS Mendocino Chardonnay 12 x 750ml
    * PRS Sunshine Vineyard Roussanne 12 x 750ml
  * Platinum
    * PLT Sao Ridge Vineyard Cabernet Sauvignon 12 x 750ml
    * PLT Two Brothers Vineyard Chardonnay 12 x 750ml
    * PLT Carneros Pinot Grix 12 x 75ml
* Commercial
  * Mallet
    * MLT California Merlot 12 x 750ml
    * MLT California Cabernet Sauvignon 12 x 750ml
    * MLT California Chardonnay 12 x 750ml
  * StoryBook
    * STB Washington Red 12 x 750ml
    * STB Washington White 12 x 750ml
    * STB Washington Rosé 12 x 750ml
  * River Edge
    * REG Texas Big Red 12 x 750ml
    * REG Texas Big White 12 x 750ml

### Add first Item for the "Group" level

{% hint style="info" %}
When you're first building out your hierarchy, it will make things a little easier if you start with the topmost levels of your hierarchy. That's why we are starting with the "Group" level we created in our Item Hierarchy. You can start at any level and move things around, but this is just a tip.
{% endhint %}

{% hint style="info" %}
You will see some default items in your hierarchy. These are created as placeholders when you first create the hierarchy. You can either delete them when you have some of your actual items created or edit them to include in your item setup.

<img src="/files/ZvnlPi1X9WOD2dd76zxV" alt="" data-size="original">
{% endhint %}

#### Create an item

To create an item:

1. Go to the "Options" button (the ellipses) in the top-right of the page and click on it.
2. Click on "Add unassigned Item".
3. A tray will slide in from the right. This is where you'll be adding the details about the item.
4. Enter the "Name" of your item.
5. Enter the "Description" of your item.
6. Click on "Save changes" button.
7. Your newly created item will now be visible in the 'Unassigned' section of the screen
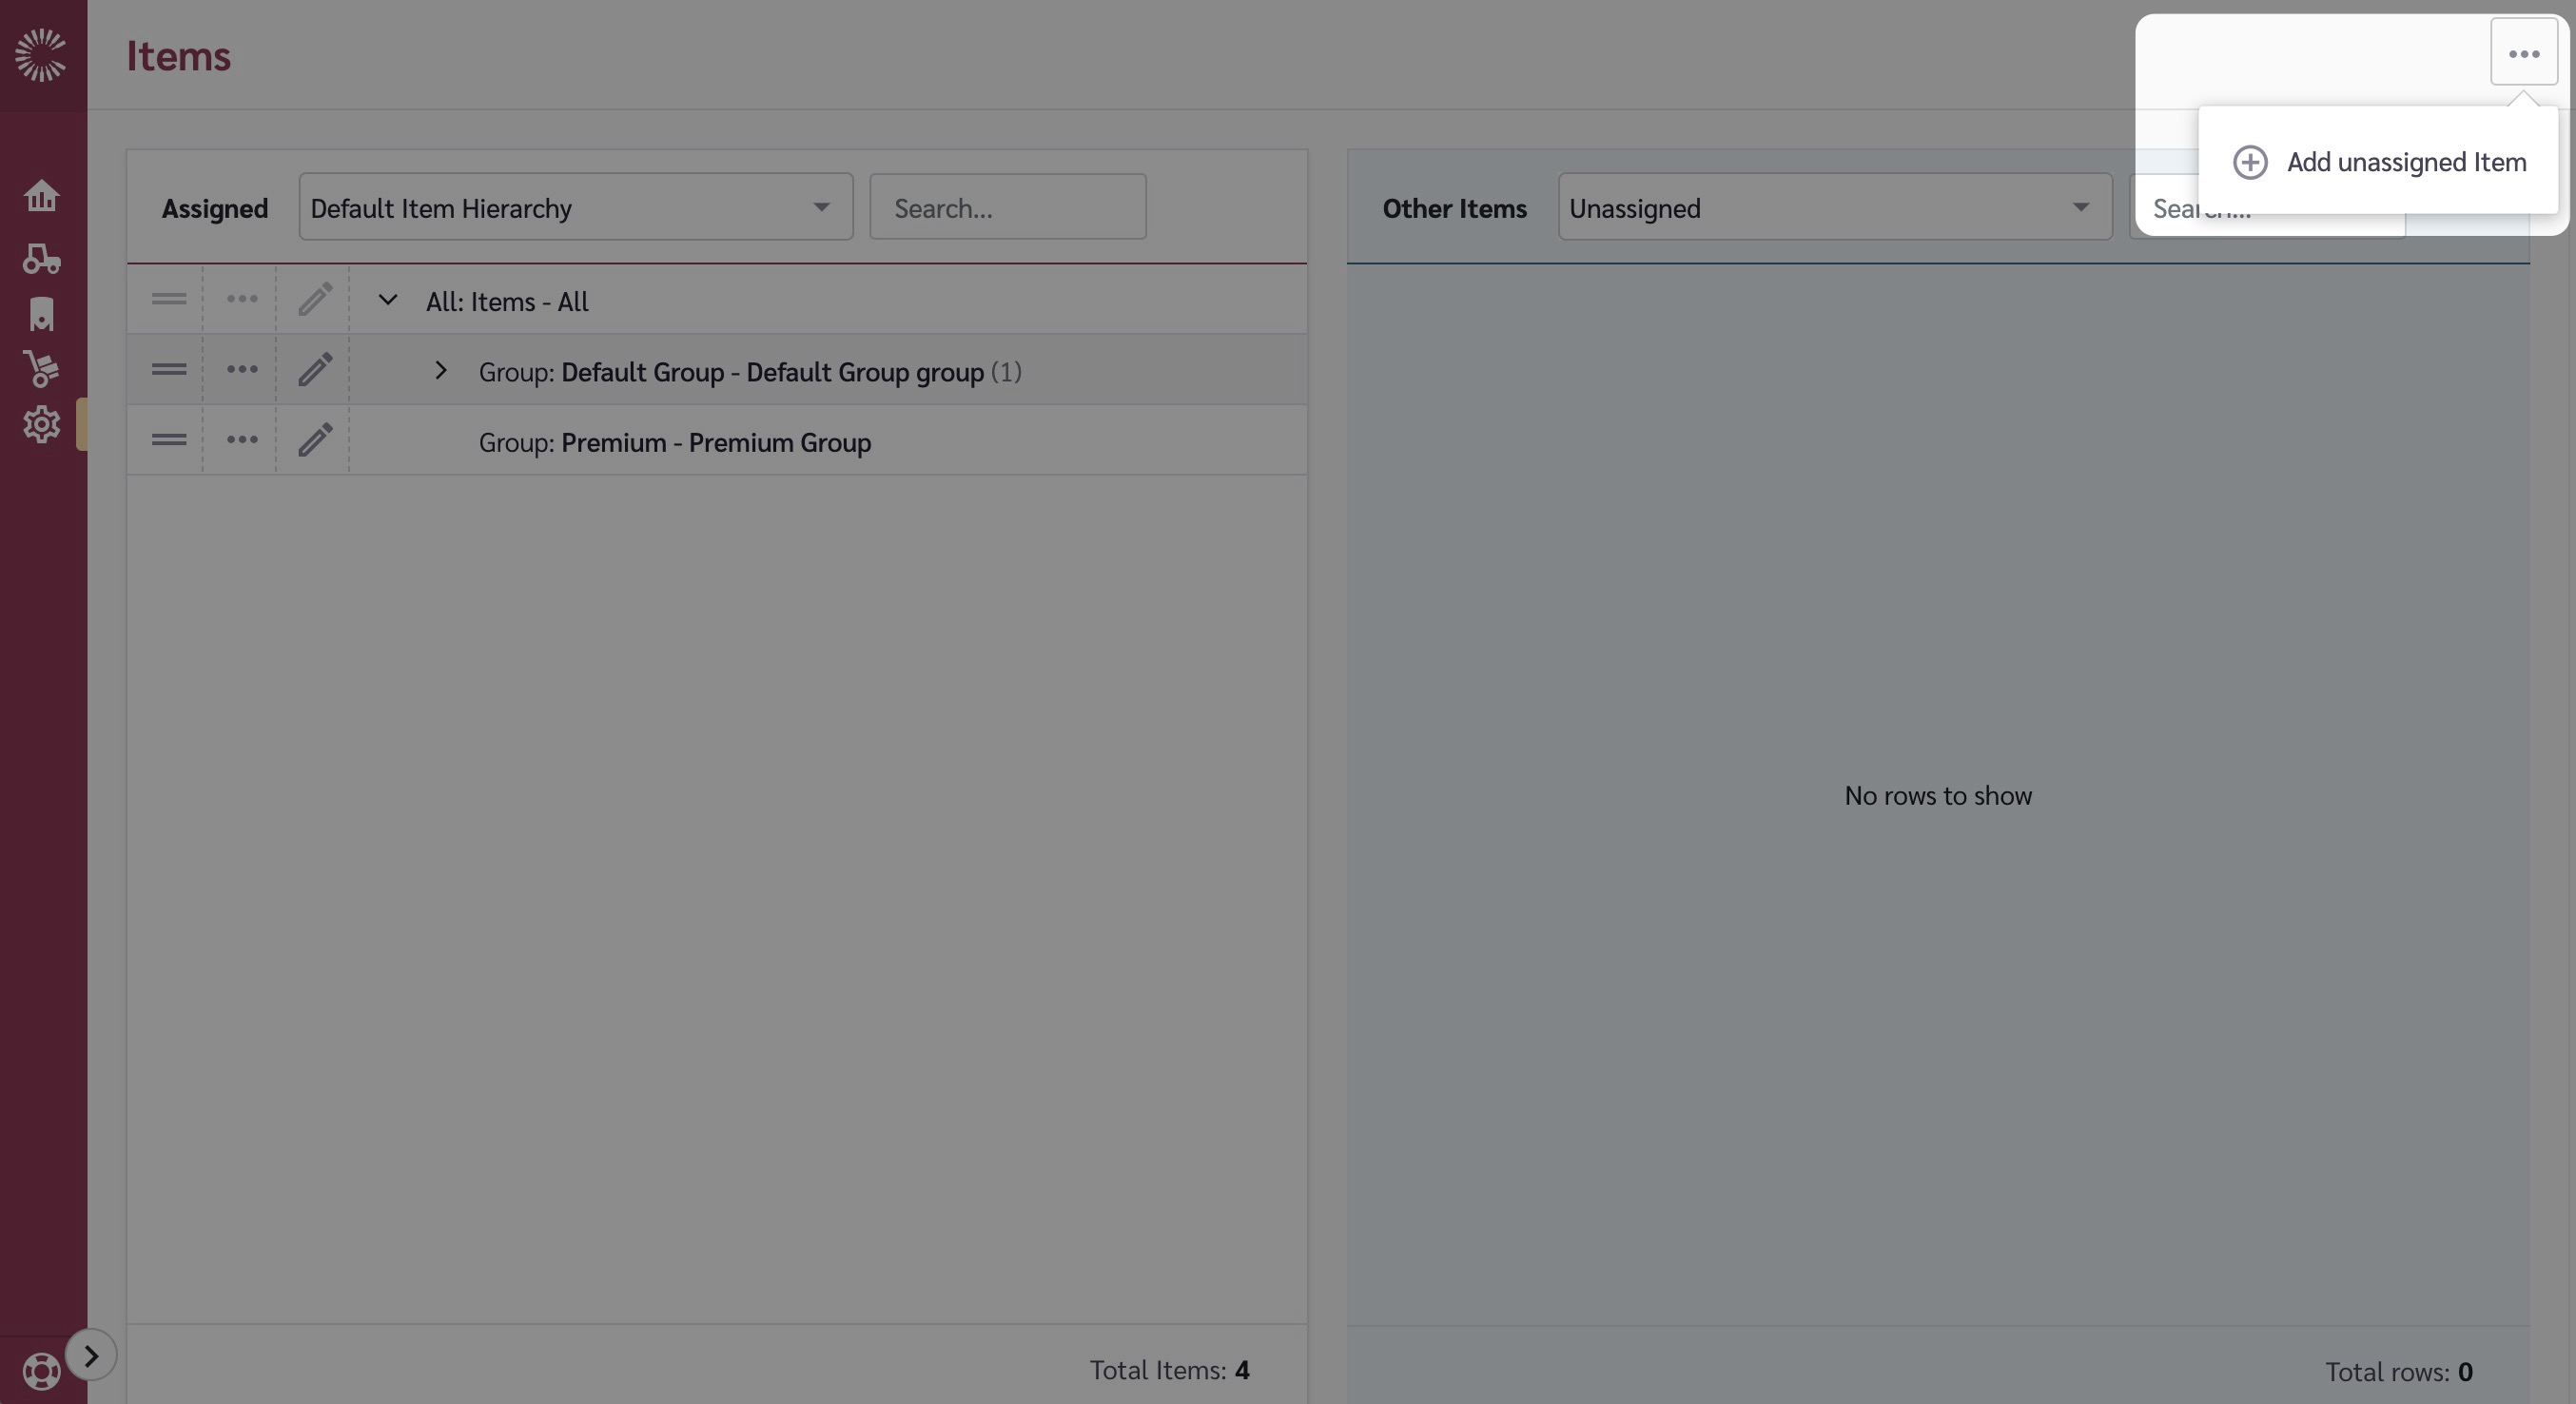
<figure><img src="/files/GgXjaCBF8VRziRiRc8BK" alt=""><figcaption><p>Select 'Add unassigned item' from the menu</p></figcaption></figure>

<figure><img src="/files/y1aK8bVfI2FjW2M77oFH" alt="" width="375"><figcaption><p>Enter the item name and description and select 'Save'</p></figcaption></figure>

<figure><img src="/files/0trkZqqW5fhVFgcKPirr" alt=""><figcaption><p>The item is now created</p></figcaption></figure>

#### Assign the item

1. Drag the newly created Item from the "Unassigned" section to the "Assigned" section. Drop it on the row that has "Items" spelled out.
2. You'll notice that it is now assigned to the "Group" level, which is the topmost level that we created in the Item Hierarchy.

<figure><img src="/files/boXgg2ChnkWCXqIlxKAR" alt=""><figcaption></figcaption></figure>

#### Adding more items

You can continue to create new items as we did above. Or, you can create them from the perspective of the item you just created. Let's create another "Group" item.

1. Click on the ellipsis button to the left of the newly created and assigned item.
2. Click on the '+' icon beside "Add another Group"
3. This will show the tray again and this is where you can create this new item - we'll create 'Commerical'.
4. By doing it this way, you are creating the item and assigning it at once.

<figure><img src="/files/MBNrbuCwBOhT52AKF4wf" alt=""><figcaption></figcaption></figure>

<figure><img src="/files/TEaV27otgxOdKIZXuuce" alt=""><figcaption></figcaption></figure>

Let's add a child item under the "Commercial" group we created.

1. Click on the ellipsis button to the left of the newly created and assigned item.
2. Click on the "Add Brand under this Group".
3. Create the item by entering in the "Name" and the "Description".

<figure><img src="/files/GXL6smwceaUm5xZs5Gmu" alt=""><figcaption></figcaption></figure>

<figure><img src="/files/EXbbj4ZgbrRQ2EvN11a0" alt=""><figcaption></figcaption></figure>

Now we have some levels of our Items hierarchy built out. We can continue with these steps to build out the rest of the Items.

<figure><img src="/files/lt99SdIFVNnCXuXVg8Ma" alt="" width="375"><figcaption></figcaption></figure>

Items can also be re-ordered and moved around the hierarchy using the drag and drop feature

<figure><img src="/files/XxP6Q73KaF9zZ6VnOVG0" alt=""><figcaption></figcaption></figure>

There may be extra data required for different item types depending on the modules you are using so for further details, and also details for importing items, please see:

1. [Finished Goods Items](/master-data/items/finished-goods-items)
2. [Bulk Wine Items and Aging Profiles](/master-data/items/work-in-process-aged-items)
3. [Crop Items](/master-data/items/crop-items)


# Finished Goods Items

Set up your products and get organized with Claret's finished goods item hierarchy & item setup. Easily manage multiple brands, product/item groups, and vintage variations.

If you wish to set up a large number of items at once, you can also do this using a file which can then be imported for you

To do this, we will need a .csv or .xlsx sheet containing your items. The sheet will need a column for each level of your hierarchy, with a name and description each time.

For example, let's say you would like to import items to build the following structure:

<figure><img src="/files/wp22wUyVWlXoBqyroE7e" alt=""><figcaption></figcaption></figure>

This example file could be used.

You can copy this and change the header rows to match your hierarchy and enter the items you wish to import.

{% file src="/files/7qgHLO1MEiJmdRrEj0Ns" %}

Once you have your file ready create a support ticket by selecting the 'Help' menu option and then selecting 'Request Support'.

<figure><img src="/files/vZEBlLTxPkI9rcb8HGnR" alt=""><figcaption></figcaption></figure>


# Work in Process - aged Items

Easily navigate and configure your work-in-process and aged items with Claret. Make the most of our simple hierarchy for WIP items and follow our comprehensive steps to get set up quickly.

If you use the Make or Farm Modules, you will need to perform some additional setup steps to ensure all your bulk wine, vintage and aging details are connected correctly.

The first part of this is the Work-In-Process, or Bulk Wine, items.

The hierarchy for these items is already set up so that's a great start. The hierarchy can be seen on the 'Work in Process - aged' tab on the Item Hierarchy page.

<figure><img src="/files/NoSCzXgRSuBX9fuKGRzL" alt=""><figcaption></figcaption></figure>

We have the Parent Work In Process (WIP) items and then their Child Work In Process items (generally used for the vintage level).

***

{% hint style="info" %}
Before you can build out your WIP items you will need to define [Routings](/master-data/routings) and Vintages
{% endhint %}

### Setting up WIP Aged Items

Now that we understand the WIP Hierarchy and have set up Routing Steps and possibly Routings, you can set up the WIP Items themselves.

Let's start with an example. Let's look at the FNE St Lucia Pinot Noir. We have Bulk Wine which we will identify as FNESLPNO (this is our Parent WIP), and then a Child WIP for each vintage.

<figure><img src="/files/z2rP9qIStXs2CyouMPDO" alt=""><figcaption></figcaption></figure>

For each Child WIP, we need to know:

* which Routing to use (in our example, we'll use the aging steps and Pinot Noir routing we set up earlier)
* the 'Age Start' date
* the Vintage (you can see these up on the 'Vintages' page, or we can create them for you on Item import.)

And for the Parent, we need to know the Current Vintage.

So the data, in tabular form, would look like this (scroll to the right for all columns):

<table><thead><tr><th width="139">Parent WIP</th><th width="227">Parent WIP Description</th><th width="152">Current Vintage</th><th width="139">Child WIP</th><th width="255">Child WIP Description</th><th width="183">Routing</th><th>Vintage</th><th width="100">Age-Start</th></tr></thead><tbody><tr><td>FNESLPNO</td><td>FNE St Lucia Pinot Noir</td><td>2022</td><td>FNESLPNO21</td><td>FNE St Lucia Pinot Noir 2021</td><td>Standard Pinot Noir</td><td>2021</td><td>2022-01-01</td></tr><tr><td>FNESLPNO</td><td>FNE St Lucia Pinot Noir</td><td>2022</td><td>FNESLPNO22</td><td>FNE St Lucia Pinot Noir 2022</td><td>Standard Pinot Noir</td><td>2022</td><td>2023-01-01</td></tr><tr><td>FNESLPNO</td><td>FNE St Lucia Pinot Noir</td><td>2022</td><td>FNESLPNO23</td><td>FNE St Lucia Pinot Noir 2023</td><td>Standard Pinot Noir</td><td>2023</td><td>2024-01-01</td></tr><tr><td>FNESLPNO</td><td>FNE St Lucia Pinot Noir</td><td>2022</td><td>FNESLPNO24</td><td>FNE St Lucia Pinot Noir 2024</td><td>Standard Pinot Noir</td><td>2024</td><td>2025-01-01</td></tr></tbody></table>

Or, if you did not set up your routings earlier, replace the 'Routing' column with a column for each of the Routing Steps you created earlier, and a value, in months, for how long the wine will be aged at that step.

<table><thead><tr><th width="139">Parent WIP</th><th width="227">Parent WIP Description</th><th width="152">Current Vintage</th><th width="139">Child WIP</th><th width="255">Child WIP Description</th><th width="121">Barrel Age</th><th width="124">Bottle Age</th><th>Vintage</th><th width="100">Age-Start</th></tr></thead><tbody><tr><td>FNESLPNO</td><td>FNE St Lucia Pinot Noir</td><td>2022</td><td>FNESLPNO21</td><td>FNE St Lucia Pinot Noir 2021</td><td>3</td><td>4</td><td>2021</td><td>2022-01-01</td></tr><tr><td>FNESLPNO</td><td>FNE St Lucia Pinot Noir</td><td>2022</td><td>FNESLPNO22</td><td>FNE St Lucia Pinot Noir 2022</td><td>3</td><td>4</td><td>2022</td><td>2023-01-01</td></tr><tr><td>FNESLPNO</td><td>FNE St Lucia Pinot Noir</td><td>2022</td><td>FNESLPNO23</td><td>FNE St Lucia Pinot Noir 2023</td><td>3</td><td>4</td><td>2023</td><td>2024-01-01</td></tr><tr><td>FNESLPNO</td><td>FNE St Lucia Pinot Noir</td><td>2022</td><td>FNESLPNO24</td><td>FNE St Lucia Pinot Noir 2024</td><td>3</td><td>4</td><td>2024</td><td>2025-01-01</td></tr></tbody></table>

You can set up each of your bulk wine items one by one using the same process described in the [Items](/master-data/items) section, but selecting the 'Default WIP Aged Hierarchy' to build your tree. You will notice you are asked to add the Vintage and aging data as you drag WIP items across from being 'Unassigned' and into the tree.

However, you can also provide us with a file to load your WIP items. The sheet will be structured in the same way as the tables above. Here is an example for you to use as a starting point, however, you can replace the 'Routing' column with your Routing Steps columns if you have not yet created any Routings (as we did in the second table above).

{% file src="/files/Td3cgrFiytNhPAxXGSv7" %}


# Crop Items

Claret App simplifies the process of creating and managing crop items. Our step-by-step guide helps you set up hierarchical structures, group your items, and create your crop items quickly and easily.

Now that you have set up your Crop Locations, we need to set up the Items that grow in those locations.

### Crop Items

Crop Items are another type of 'Item' within Claret and are used to manage raw material, crop-based, inputs into your work in process and finished good items - generally, grapes.

In the same way that we set up a hierarchy for our finished good and work-in-process items earlier, we must now set up our hierarchy for our crop items.

The Crop Item Hierarchy is set up on the 'Item Hierarchy' page, on the 'Raw Material' tab.

<figure><img src="/files/Ue0k3mkydCMFIyylhQ9T" alt=""><figcaption></figcaption></figure>

To build out your hierarchy, the steps are exactly the same as those followed earlier for Crop Locations, Items, and Customer Groups.

For this example, we have set up a simple structure containing just Crop at the lowest level and then Group to group these.

We can then use this to build out our crop items. An example using this hierarchy would be:

<figure><img src="/files/0SjFlnpC5NCrh7dK7AEY" alt=""><figcaption></figcaption></figure>

Once you've set up your hierarchical structure, you can go ahead and create your crop items. As with our other item types, there are a couple of ways to do this.

1. File import - we can import all your crop items for you. To do this, we will need a .csv or .xlsx sheet containing your crop items. The sheet will again need a column for each level of your hierarchy, with a name and description each time.

Here is an example sheet using our example crop items from above. You can copy this and change the header rows to match the hierarchy you built earlier.

{% file src="/files/wxg9XfWwBJzxFqDvvk6M" %}

2. One by one - you can add your Crop Items and build out your structure using the instructions detailed on the [Items](/master-data/items) page.

Now that Crop Locations, and Crop Items have been set up, you can use the Crop Supply Plan we created in [7. Supply Types](/master-data/supply-types) to start planning your crop item supply at each location.


# Item Hierarchy

Learn how to set up the Item Hierarchy Structures that will be used to organize and group your items (finished goods, work in process (WIP), and raw materials/crops).

Within Claret, Item Hierarchies are used to manage how you structure your items. There are 3 different types of Item Hierarchy and the types you need will depend on the modules you have access to.

The 3 types of hierarchy are:

* Finished Goods - these hierarchies define the levels of the items that you sell. In our example below we show you how to set up your first finished good Item Hierarchy.
* Work in Process - this hierarchy defines the levels of the items that form ingredients for your finished goods. For example, in the wine industry, these items would be the bulk wine that is then bottled into your finished good items. This hierarchy is pre-defined and only has 2 levels.
* Raw Materials - this hierarchy defines the level of the items you begin with. These will be inputs into your Work in Process and Finished Goods items. For example, in winemaking, one raw material would be grapes.

The modules within Claret require the following hierarchies to be set up:

<table><thead><tr><th>Module</th><th width="184">Finished Good Hierarchy</th><th width="184">Work in Process Hierarchy</th><th>Raw Material Hierarchy</th></tr></thead><tbody><tr><td>Sell</td><td><ul class="contains-task-list"><li><input type="checkbox" checked></li></ul></td><td></td><td></td></tr><tr><td>Make</td><td><ul class="contains-task-list"><li><input type="checkbox" checked></li></ul></td><td><ul class="contains-task-list"><li><input type="checkbox" checked></li></ul></td><td></td></tr><tr><td>Farm</td><td></td><td><ul class="contains-task-list"><li><input type="checkbox" checked></li></ul></td><td><ul class="contains-task-list"><li><input type="checkbox" checked></li></ul></td></tr></tbody></table>

In this example we will show you how to set up your first Item Hierarchy.

### Navigate to the Item Hierarchy page

1. Go to the navigation sidebar.
2. Click on "Settings" menu item.
3. Click on "Master Data" menu item.
4. Click on "Item Hierarchy".

<figure><img src="/files/BMXkBQX80NdiKhj4tUAW" alt=""><figcaption></figcaption></figure>

### Select the hierarchy type and hierarchy

Click on the tab at the top which relates to the Item Hierarchy you wish to work with.

<figure><img src="/files/mcW0A08V5Ab06Z2Djkuz" alt=""><figcaption><p>Select the item hierarchy type</p></figcaption></figure>

In this example we will work with the 'Finished Good' hierarchy type.

Next select the Hierarchy you wish to work with. A default hierarchy will have been set up for you to start with so you can select this to work with.

<figure><img src="/files/roW73dsZ2q9Zh8R72y7I" alt=""><figcaption></figcaption></figure>

### Update the name of an initial lowest level

1. Click on the name of a level.
2. This will turn the text into an input box where you can update the name.
3. Make your update.
4. To save your update, simply click outside of the hierarchy-level rectangle you're updating.

![](/files/-MiXRDmuXKhVjZXZfE_T)

### Adding your first new level

When you're first creating a hierarchy, you will be provided with 2 initial levels. When you want to add a new level, you'll be able to add a parent to these initial levels.

1. Click into the "Add new level" rectangle and begin typing the name of the level.

![](/files/-MiXRZ-e9dM9FS_IYTNK)

### Deleting a level

You can only delete the top most level in the hierarchy. You do this by clicking on the delete icon (trashcan) on the right-hand side of the level.

![](/files/-MiXSEKiLqQ8ZoH9Sf36)

{% hint style="warning" %}
When adding or deleting rows, any items you have set up will be affected. If you have any questions relating to the impact of adding or deleting hierarchy levels once you have all your items in place, then contact Claret support to talk through your requirements.
{% endhint %}


# Item @ Customer Groups

Easily connect your Finished Goods items to Customer Groups with Claret App. Manage sales forecasting and record sales at the customer level for better decision-making power.

The Item @ Customer Group master data is one of the core foundations for the various modules within Claret that is related to showing any type of sales data. This allows you to represent the lowest-level Item being sold at the lowest-level Customer Group. For instance, say we sell the ZAM Napa Valley Cabernet Sauvignon 12 x 750ml item at the SRV Beer & Wine, Inc. customer group. We need to put these two pieces of master data together in Claret before we can forecast them or show their history or bring in their open sales orders. In this guide, we will walk through just how to do that and much more.

### Item\@Customer Group

\
The Item\@CustomerGroup is a connection between what you sell and who you sell it to so you can forecast and record sales at the customer level.

Once your Finished Goods items and Customer Groups are set up this is fairly straightforward to do.

If you sell (or might sell) all your items to all your customer groups, you can connect them all in one step.

### Navigate to the Item\@Customer Groups page

1. Go to the navigation sidebar.
2. Click on "Settings" menu item.
3. Click on "Master Data" menu item.
4. Click on "Item @ Customer Groups".

<figure><img src="/files/4Igcb9SJvNfdXptvpozZ" alt=""><figcaption></figcaption></figure>

### Add an Item @ Customer Group

1. Select the finished good item hierarchy and customer group hierarchy that you wish to connect.
2. Go to the "Options" button (the ellipses) in the top-right of the page and click on it.
3. Click on "Add".

<figure><img src="/files/tRFE4SHTUFhuBTEvXAox" alt=""><figcaption></figcaption></figure>

4. If you have items at the vintage level (the 'Lowest Sub-Level') you will need to select which level of item you wish to connect to customer groups (as both are possible). If you do not having anything below the 'Lowest Level' you can simply select the level and select 'Next'.

<figure><img src="/files/FxeKyjXKqyX75w3pmC4r" alt=""><figcaption><p>Select which level you wish to connect</p></figcaption></figure>

5. Select all the items and customer groups you wish to connect. To do this, you can select the cards at any level of your hierarchy and this will automatically select all items / customer groups beneath.

For example, im the below we are connecting all Items within the Commercial brand group with all customer groups in the 'East Division'. This will create an item\@customergroup record for every combination of these.

<figure><img src="/files/8kIMY6Z6cNfQwJCmftHj" alt=""><figcaption></figcaption></figure>

6. Select 'Add'.

### Deleting Item @ Customer Groups

{% hint style="danger" %}
Because the Item @ Customer Groups is a foundational piece of data, if you delete them, any sales data related to them will also be removed. Remember that the sales data exists in Claret because of Item @ Customer Groups.
{% endhint %}

1. Click on the checkbox for each row that you want to delete.
2. Go to the "Options" button in the top-right of the page and click on it. Click on "Delete selected".


# Item @ Locations

Create multiple item\@location records in one step and add inventory and supply plans for those items and locations.

When tracking inventory, and also in some instances when planning supply and demand (for example crop supply), you will want to connect your items and locations.

To create your Item\@Locations, go to the Items\@Locations master data page.

<figure><img src="/files/FGo6uI1mpryyz1XVrhds" alt=""><figcaption></figcaption></figure>

Select the item hierarchy that you wish to connect to Locations. Depending on the modules you are using you may need to do this for your finished good item hierarchies, your work in process (WIP) hierarchies and/or your raw material hierarchies.

If you select a raw material hierarchy, you will also then need to select the crop location hierarchy you wish to connect. (This will not be required for finished good or work in process item hierarchies).

To add a new Item\@Location, select 'Add' from the Options menu.

<figure><img src="/files/Ghe0N794vSouaekl62sa" alt=""><figcaption></figcaption></figure>

In the same way as we connect [Items and Customer Groups](/master-data/item-customer-groups), we will now need to select the Item level we wish to connect. In most cases there will only be one option, however if you have both planning level and vintage level finished goods items you will need to select which level you are connecting.

Most cases:

<figure><img src="/files/XF49EOTlh7ZTYBcFviwL" alt=""><figcaption></figcaption></figure>

Finished Goods Hierarchies with a vintage level:

<figure><img src="/files/37uuEvjCnZVJgr2V9sfa" alt=""><figcaption></figcaption></figure>

Select the level, and then select 'Next'.

Select the Item(s) and Location(s) you wish to connect. To select a whole level of the hierarchy, use the selectors on the right hand side of the level. This will automatically select any children.

<figure><img src="/files/YS4XExASdQ3V03fdez0d" alt=""><figcaption></figcaption></figure>

Select Add, and all these item\@locations records will be created.

You can now add supply plans for these items at these locations.


# Location Maintenance

Streamline your wine storage and stock control operations. With powerful location and bin tracking tools, you can easily manage all of your winery's physical locations from one centralized platform.

The last main piece of master data you'll need to set up for some features of Claret is Locations. Locations are physical areas where wine may be stored.

Locations in Claret are treated slightly differently to Items and Customer Groups. There is a standard setup with the ability to have Locations at the top level. Within these you then have Location Areas and then Bins within these. Bins have a type and can be used by you to define different types of locations/storage within your location areas.

Let's look at an example. Locations are managed within the Master Data > Location Maintenance page.

<figure><img src="/files/VbFidgEMb7uCdBVNXgjh" alt=""><figcaption></figcaption></figure>

Here, we can see Locations have been set up for:

* the winery itself - ZAM Winery
* an internal warehouse - ZAM Apps Warehouse
* a partner warehouse - ZAM Partner Warehouse
* a supply location - Strategy Supply Location
* a bottling supplier - Bottling Supplier.

Let's then expand out the ZAM Apps Winery. There are 2 location areas, all with stainless steel tank storage (bins).

<figure><img src="/files/W9c7QPMeWMKO34u82Nyt" alt=""><figcaption></figcaption></figure>

The ZAM Apps Warehouse on the other hand has just one Location Area - 'Storage' and one Bin - for Finished Goods storage.

<figure><img src="/files/2nexPwlirBjU0AP0mX3t" alt=""><figcaption></figcaption></figure>

As you can see, there is a lot of flexibility possible in how you set up your locations.

When thinking through your structure, keep in mind that any inventory loaded into Claret will need to be put against a Location.

Before you set up your Locations, we first need to know what Bin Types you want to set up. This is where you might define a Stainless Steel tank type, Barrels, and perhaps a Finished Good bin. You can be as granular or as high-level as required. Here is an example:

<figure><img src="/files/rkyYBx4uSbhPu5FmPRq5" alt=""><figcaption></figcaption></figure>

To add a Bin Type, go to the 'Bin Types' tab on the Location Maintenance page and then select 'Add Bin Type' from the options (ellipses) menu.

<figure><img src="/files/rZfuUiHU1KzOoQietGe3" alt=""><figcaption></figcaption></figure>

Enter a name and description for your 'Bin Type' and then select 'Save'.

<figure><img src="/files/7Lxmc2dUfPOMpmoZcQ3S" alt=""><figcaption></figcaption></figure>

You will now be able to select your new type when adding bin locations.

Now we are ready to start setting up your Locations. To add your first location, return to the 'Locations' tab on the Location Maintenance page and then go to 'Add Location' within the options (ellipses) menu.

<figure><img src="/files/w0Uzb6FMItRo4j9JH1iD" alt=""><figcaption></figcaption></figure>

Give your location a Name and Description, and then Save. This will be a top-level Location.

Once you add your top-level Location(s), you then use the ellipses beside your location to add location areas beneath.

<figure><img src="/files/LWqDpgL2ZDlHH4uIj38Z" alt=""><figcaption></figcaption></figure>

And then add your bins beneath your location areas in the same way.

<figure><img src="/files/CQMBSkhY1m7ubu5oNN1M" alt=""><figcaption></figcaption></figure>

If you have a large number of locations, you can also add your Locations by sending a file to the Claret support team to load for you.

Here is an example file you can complete with your data. This contains the example from above, which you can use as a guide for how to complete the template. We will also add your Bin Types when loading the locations if you have not created them already.

{% file src="/files/mKbSsu9LBsjOZTz9Rlh6" %}

{% hint style="info" %}
The above assumes you have one status for the Bins at your locations. Each bin can have a status - which you can use to take storage offline or another status if required. The default status is 'open'; however, you can add more on the 'Bin Volume Statuses' tab within Location Maintenance if required.
{% endhint %}


# Recipes

Connect finished goods to bulk wines and create recipes to map sales history and forecasts for an improved workflow.

Recipes within Claret are the links that connect each module. Recipes define the work-in-process items (eg Bulk Wine) that go into finished goods, and the crop ingredients (eg grapes) that go into the bulk ingredients.

Let's look at two examples - Finished Good Item 108 - the FNE St Lucia Pinot Noir and WIP Item FNESLPNO - the FNE St Lucia Pinot Noir bulk

<figure><img src="/files/Vr8LLVByocu4sbLYv36a" alt=""><figcaption></figcaption></figure>

There are 2 levels of recipes required to connect the Finished Goods items and WIP Items.

* To map sales history, and finished good inventory, back to bulk, we need to map the vintage level finished good items to the vintage level WIP items
  * eg 108-21 uses FNESLPNO21 in it's recipe
* To map sales forecasts back to bulk we need to map the parent level (non-vintage) finished good item to the Parent WIP item.
  * eg 108 uses FNESLPNO in it's recipe

So, to build out the recipes for the FNE St Lucia Pinot Noir example above, we would need the following set of recipes:

<table><thead><tr><th width="162">Finished Good</th><th width="203">Ingredient (WIP Item)</th><th width="299" align="center">Quantity in 1 9LE of Finished Good</th><th>UOM of Quantity</th></tr></thead><tbody><tr><td>108</td><td>FNESLPNO</td><td align="center">2.38</td><td>Gallon</td></tr><tr><td>108-21</td><td>FNESLPNO21</td><td align="center">2.38</td><td>Gallon</td></tr><tr><td>108-22</td><td>FNESLPNO22</td><td align="center">2.38</td><td>Gallon</td></tr><tr><td>108-23</td><td>FNESLPNO23</td><td align="center">2.38</td><td>Gallon</td></tr><tr><td>108-24</td><td>FNESLPNO24</td><td align="center">2.38</td><td>Gallon</td></tr></tbody></table>

Recipes are managed in Claret within the Master Data > Recipes page. To add your recipes, start by going to this page and selecting 'Add' from the Options (ellipses) menu in the top right of the screen. (Any recipes already created will be listed on this page).

<figure><img src="/files/yeUIQjK8z6jNqy3kje1w" alt=""><figcaption></figcaption></figure>

The first step is to add the 'Recipe Header'. This is the details of what product the recipe is for - ie - what is the end product of the recipe.

When adding the header, you will need to define the Recipe Type. The options are:

* Operational, with items only
* Strategic, with items only - generally used for Make Planning
* Strategic, with items at locations - used where the recipe requires items from a particular location- for example, a recipe for bulk wine that requires crop items from particular locations.

You will also need to select the item and indicate the yield quantity and UOM that the recipe will yield.

<figure><img src="/files/rLDZHLsAmoJFHqmd2beY" alt=""><figcaption></figcaption></figure>

We will add the first row from our table above. Given our table indicates the recipes are all for one 9LE, we use this as our yield quantity.

<figure><img src="/files/HNzgAN81l2uQ3bn8gRWD" alt=""><figcaption></figcaption></figure>

Hitting 'Save' will then create the recipe at the bottom of the grid. We now need to add the 'Recipe Details' - the ingredients. Use the arrow in the 'Recipe Details' column to expand out the recipe and begin to add rows.

<figure><img src="/files/MbbMcBkwDY3sS7ZxoBsd" alt=""><figcaption></figcaption></figure>

You will need to add one 'Recipe Detail' row for each ingredient. Our recipes above only have 1 ingredient. The single ingredient to make 1 9LE if item 108 is 2.38 gallons of bulk wine FNESLPNO. So we enter these details into the Recipe Detail add screen and then hit 'Save'.

<figure><img src="/files/LVW2uOsWJZOpHe0dGd3r" alt=""><figcaption></figcaption></figure>

<figure><img src="/files/2XPEMPuf73h7jJH50pLs" alt=""><figcaption></figcaption></figure>

{% hint style="info" %}
The above assumes a conversion of 1. Recipes can be set with a more granular breakdown of UOM and conversion. For example, for a bulk wine recipe, we may have 2 tonnes of pinot grapes as an ingredient, but the 'Convert to UOM' might be gallons.
{% endhint %}

The following table indicates the recipe levels required for each feature to function.

| Feature              | Recipes needed                              |
| -------------------- | ------------------------------------------- |
| Sales Collaboration  | None                                        |
| Long Term Planning   | None                                        |
| Forecast Workbench   | None                                        |
| Make Planning        | Finished Goods recipes (ingredients = bulk) |
| Crop Supply Planning | Bulk Wine Recipes (ingredients = crops)     |
| Inventory Workbench  | None                                        |

You can either load your recipes one by one as above or complete a file that can then be provided to the Claret support team to load into Claret for you. The template provided below can be used. This is completed with our above example so you can see how to complete the template. You can replace this data with your data.

{% hint style="info" %}
When completing the template, you will need to use the Finished Good Item Name(s) that you used when creating your Finished Goods in step 1, and the WIP Item Name(s) that you created in Step 5 and the Crop Item Names you created when setting up Crops (if you have already completed that step). That is, Claret already needs to know about any items that you plan to use in Recipes.
{% endhint %}

{% file src="/files/tAiOr3GJ9SPkVQjYV5Xl" %}


# Routings

Set up standard aging profiles which can then be linked to bulk products

Routings are used when defining Work in Process Items.

Work in Process items have a bit more information attached to them than Finished Good items.

* For Parent WIPs, we need to know which vintage is the Current Vintage, and how long you age the WIP for,
* For Child WIPs, we need to know the Vintage and when you plan to start agingw.<br>

Within Claret, we also use Routings to manage aging periods. How you use these depends on how you manage aging.

\
First, we must set up the steps that may occur within your aging process. You may wish to break your aging process down into steps like ‘Time in Barrel’ and ‘Time in Bottle’, or just have one step for ‘Aging’.

To set up these steps, go to the 'Routing Steps' tab within the Routings page. Then add your required standard step(s) by going to the options (ellipses) button in the top right and selecting 'Add Routing Step'. The example below shows a 'Barrel age' and 'Bottle age' set of steps, but you can set up whatever works for you.

<figure><img src="/files/Vfz0aqZqq29CLtI4WDFp" alt=""><figcaption></figcaption></figure>

{% hint style="info" %}
If you set up more than one 'Aging' step, not all steps have to be used in the aging profile (routing) of every wine. You can pick and choose.
{% endhint %}

Now that we have the steps set up, we can use these to build out the routings. There are a couple of ways to do this, depending on how you manage your aging profiles.

If you manage your aging profiles based on the type of wine, we can set up the routings now and then connect these to your bulk wine items later. If you want your routings to be automatically set up when we create your items, then jump down to [Setting up WIP Aged Items](#wip-aged-items).

To set up routings now, go to the Routings tab on the Routings page.

<figure><img src="/files/vxhBa71GB1CUYiE3MX7e" alt=""><figcaption></figcaption></figure>

The above screenshot shows an example 'High-grade Cabernet Sauv' routing with 2 steps - 3 months in 'Barrel age' and 3 months in 'Bottle age' for a total routing/aging of 6 months.

To add your routings here, go to the 'Add Routing' option in the Options (ellipses) menu in the top right.

<figure><img src="/files/GyVOyBdYhx88GzPxc5LS" alt=""><figcaption></figcaption></figure>

Here you can add a name and description for your Routing. For example, 'Standard Pinot Noir'.

<figure><img src="/files/d3RVjWp6G32EjNkkO11N" alt=""><figcaption></figcaption></figure>

Hit 'Save', and you will see the routing added.

You can now add steps to the routing by first expanding out the row and then selecting the + button.

You will need to indicate a sequence number - this is the order in which the steps will occur, and indicate how long this particular aging step will take. Continue to add steps as required by your routing profiles.

<figure><img src="/files/DkIylbw0O2iV5UgGfrPO" alt=""><figcaption></figcaption></figure>

Subsequent routings can be added by repeating the steps above.


# Sale Types

Get started with Sale Types in Claret's Sell module. Learn how to add, and delete Sale Types, and understand the significance of 'Category Type' in this guide.

Sales Types are used to capture your sales data. Once you have set up your items and customer groups, you are ready to enter historical and forecast sales data. These sales numbers will be entered at the Item and Customer Group level, against Sale Types.

Within Claret's Sell functionality, the key transactional data is [Sales](/transactional-data/sales). This is one table that stores historical sales, forecasted sales, open sales orders, etc. We differentiate these types of data with... well, Sale Types.

A Sale Type is a very simple data structure that unlocks a lot of power and flexibility in how you store and build your sales data. When you initially build out Claret, you'll want to start out with the Sale Types. Start with "History", "Forecast", "Long Term Plan" and maybe "Budget". You can create and name them how you'd like, but as you get into the different modules in Claret's Sell, starting with a simple set of Sale Types will help you and your team understand how Sale Types drive your planning. After you're comfortable with Claret, you can start to add more Sale Types and use them to further enhance your planning processes.

Within Claret, there is a lot of flexibility in how many sets of sales numbers you wish to manage. The modules of Claret you are using will influence the sales data you bring into Claret, and which Sales Types you will need to create.

The following is a recommended set of Sale Types as a starting point.

<table><thead><tr><th width="242">Module</th><th>Sales Types</th></tr></thead><tbody><tr><td>SELL</td><td>History</td></tr><tr><td></td><td>Forecast</td></tr><tr><td></td><td>Budget</td></tr><tr><td>MAKE</td><td>History-vintaged</td></tr><tr><td></td><td>Forecast for Make</td></tr><tr><td>FARM</td><td>Crop Sales History</td></tr><tr><td></td><td>Crop Sales Forecast</td></tr></tbody></table>

## Setting up a Sales Type

### Navigate to the Sale Types page

1. Go to the navigation sidebar.
2. Click on "Settings" menu item.
3. Click on "Master Data" menu item.
4. Click on "Sale Types".

![](/files/-MkIVW9InScxH_tDNXq0)

### Add a Sale Type

1. Go to the "Options" button (the ellipses) in the top-right of the page and click on it.
2. Click on "Add Sale Type".
3. In the tray that shows on the right side of the page, type in the "Name" field the name you want to give the Sale Type.
4. Then choose the "Category Type".
5. Click on the "Save" button.

{% hint style="info" %}
"Category Type" is used to let various modules in Claret know what category the Sale Type is in. For instance, the "historical" category type is treated a little differently in the app than say the "forecast" or "transactional". With a "historical" category type you won't be able to edit the sales data while in the Sales Collaboration tool, as an example.
{% endhint %}

![Type in the name of the Sale Type and choose the Category Type](/files/-MkIfXuN4JwZ65T6-X2c)

![Newly created Sale Type](/files/-MkIfqfYrhgj1R5flzCa)

### Deleting a Sale Type

{% hint style="danger" %}
Because the Sale Type is a foundational piece of data, if you delete one, any sales data related to the Sale Type will also be removed.
{% endhint %}

1. Click on a Sale Type row.
2. A tray will show up on the right side of the page.
3. Click on the "Delete Sale Type" button.
4. You will be prompted to confirm the deletion.
5. To remove the Sale Type, type the word "DELETE" into the input box and click the "Delete" button.

![To remove the Sale Type, type in "DELETE" and click on "Delete" button](/files/-MkIh90GCUEnWbA22dLc)


# Supply and Demand Map

Connect your supply sources (Item-Locations) with customer demand (Item-Customer Groups) and control how supply is allocated across your customer base.

In Claret, supply is managed at the Item-Location level (where products are made or stored), while demand is managed at the Item-Customer Group level (who buys your products). The Supply and Demand Map bridges these two concepts, allowing you to define which locations supply which customer groups and how supply should be distributed.

This is particularly useful when you have multiple warehouses or production facilities serving different customer segments, or when you need to control how limited supply is allocated across your customer base.

{% hint style="info" %}
Before setting up the Supply and Demand Map, you should have your [Item @ Locations](/master-data/item-locations) and [Item @ Customer Groups](/master-data/item-customer-groups) configured.
{% endhint %}

## Setting up Supply and Demand Mappings

### Navigate to the Supply and Demand Map page

1. Go to the navigation sidebar.
2. Click on "Settings" menu item.
3. Click on "Master Data" menu item.
4. Click on "Supply and Demand Map".

<figure><img src="/files/CU4PnzVNgFh0Vj4knk4M" alt=""><figcaption></figcaption></figure>

### Add a Supply and Demand Mapping

1. Go to the options (ellipses) button in the top-right of the page and click on it.
2. Click on "Add".
3. In the modal that appears, select the following:
   * **Supply Item** - The item being supplied
   * **Location** - Where the item is supplied from
   * **Demand Item** - The item being demanded (often the same as the supply item)
   * **Customer Groups** - One or more customer groups receiving this supply
4. Click on the "Save" button.

{% hint style="info" %}
You can select multiple customer groups at once when creating mappings. This will create separate mapping records for each customer group selected.
{% endhint %}

<figure><img src="/files/L4tK994vCWS1Vg5jip9j" alt=""><figcaption></figcaption></figure>

In the example above, supply of Item 122-21 stored at ZAM Apps Warehouse will be 100% allocated to demand for 122-21 at the selected Customer Groups.

### Edit an Allocation Factor

The allocation factor determines what percentage of supply from a location is allocated to a specific customer group. By default, new mappings have an allocation factor that can be adjusted as needed.

1. Click the Edit icon beside the mapping you wish to edit the allocation for.
2. A tray will slide in from the right.
3. Modify the "Allocation Factor" value (0-100%).
4. Click on the "Save" button.

{% hint style="info" %}
If you have multiple customer groups mapped to the same item-location, you may want their allocation factors to sum to 100% for accurate supply planning.
{% endhint %}

{% hint style="warning" %}
For existing mappings, the allocation is the only data that can be edited. If you wish to edit other details for a mapping, delete the existing mapping and create a new one.
{% endhint %}

<figure><img src="/files/99bcgQSDnWHoHyVipuz0" alt=""><figcaption></figcaption></figure>

### Delete a Mapping

1. Click the Edit icon beside the mapping you wish to delete.
2. A tray will slide in from the right.
3. Click on the "Delete" button.
4. You will be prompted to confirm the deletion.
5. To remove the mapping, type the word "DELETE" into the input box and click the "Delete" button.

### Export Mappings

You can export your Supply and Demand Map data to CSV by going to the options (ellipses) button in the top-right of the page and selecting "Export".

## Understanding the Grid

The Supply and Demand Map grid displays the following columns:

| Column            | Description                                           |
| ----------------- | ----------------------------------------------------- |
| Supply Item       | The item being supplied                               |
| Location          | The location supplying the item                       |
| Demand Item       | The item being demanded                               |
| Customer Group    | The customer group receiving supply                   |
| Allocation Factor | Percentage of supply allocated to this customer group |

<figure><img src="/files/IlCEMlqQ7RpDZ0GMa2ri" alt=""><figcaption></figcaption></figure>


# Supply Types

Claret App simplifies inventory management and makes creating supply types a breeze. Plan for items, locations, dates, and quantities with ease and stay on top of your supply needs.

Just as Sales Types are used to capture sales demand and history, Supply Types are used to capture planned and actual supply - supply plans. A supply plan record contains an item, date and quantity, or an item at a location, date and quantity.

There are a minimum set of Supply Types required to be set up for each function to work. These supply types are:

| Function             | Supply Type      | Comments                                                                                                                                       |
| -------------------- | ---------------- | ---------------------------------------------------------------------------------------------------------------------------------------------- |
| Make Planning        | Make Plan - Main | This is the actual planned supply of vintage WIP items. When you enter 'Planned' quantities in Make Planning, this is where they will save to. |
| Crop Supply Planning | Crop Supply Plan | Planned supply of crop items                                                                                                                   |

To add your Supply Types go to the 'Supply Types' page and select 'Add' from the options (ellipses) menu.

<figure><img src="/files/XX3eaCqnSnYeknz7p4xV" alt=""><figcaption></figcaption></figure>

Enter a name and description (you can use the suggestions above or your own name) and select a category type from:

* items-only - for supply plans where location is not a parameter or not yet known (eg long-term plans)
* item-locations - for supply plans where the item-locations are a parameter

Hit 'Save', and the supply type will be created.

<figure><img src="/files/60ykuypixShOlZVOfUtN" alt=""><figcaption></figcaption></figure>


# Tags

Use Tags in Claret to organize and categorize your Items for easier filtering and grouping.

Tags provide a flexible way to label and categorize WIP Items in Claret. You can create custom tags and apply them to items in your WIP hierarchy, making it easier to filter, group, and organize your data.

This is particularly useful when you want to group Work In Process items by brand, product line, or marketing category - groupings that may not fit into your standard WIP item hierarchy.

{% hint style="info" %}
Tags can currently only be used to filter items within the Make Planning module.
{% endhint %}

## Setting up Tags

### Navigate to the Tags page

1. Go to the navigation sidebar.
2. Click on "Settings" menu item.
3. Click on "Master Data" menu item.
4. Click on "Tags".

<figure><img src="/files/S35K5GxieaoB0FYbXPoV" alt=""><figcaption></figcaption></figure>

### Add a Tag

1. Go to the options (ellipses) button in the top-right of the page and click on it.
2. Click on "Add Tag".
3. A tray will slide in from the right. Type in the "Name" field the name you want to give the Tag.
4. Click on the "Save" button.

{% hint style="info" %}
Tag names must be unique and at least 2 characters long.
{% endhint %}

<figure><img src="/files/ar7LYoVfVfc30aNXgu0b" alt=""><figcaption></figcaption></figure>

### Edit a Tag

1. Click on the Edit icon beside the tag you wish to edit.

<figure><img src="/files/dlxULFqo2Ak6sw00c5Jq" alt=""><figcaption></figcaption></figure>

2. A tray will slide in from the right.
3. Modify the name as needed.
4. Click on the "Save" button.

### Delete a Tag

{% hint style="warning" %}
Deleting a tag will remove it from all associated Items. This action cannot be undone.
{% endhint %}

1. Click on the Edit icon beside the tag you wish to delete.

<figure><img src="/files/dlxULFqo2Ak6sw00c5Jq" alt=""><figcaption></figcaption></figure>

2. A tray will slide in from the right.
3. Click on the "Delete Tag" button.

<figure><img src="/files/KjF3Xk073MoTF2S3a5MV" alt=""><figcaption></figcaption></figure>

4. You will be prompted to confirm the deletion.
5. To remove the Tag, type the word "DELETE" into the input box and click the "Delete" button.

## Applying Tags to Items

Tags are applied from the Items page, not from the Tags page. When editing an Item, you will see a Tags field where you can select one or more tags to apply.

To tag an Item:

1. Navigate to **Settings** > **Master Data** > **Items**.
2. Click on an Item row to open the edit tray.
3. In the Tags field, select the tags you want to apply. (Or to remove a tag, unselect it.)
4. Click on the "Save" button.

<figure><img src="/files/DaaeXpadZeBfVlDwyLWv" alt=""><figcaption></figcaption></figure>


# Varietals

Set up and manage Varietals in Claret to categorize your products by grape variety or product type.

Varietals represent different product varieties in Claret, commonly used in wine and agricultural operations to categorize products by variety (e.g., Pinot Noir, Chardonnay, Cabernet Sauvignon). Each varietal has a name, code, and associated color classification.

Varietals are assigned to Parent WIP items. See [Work In Process Aged Items](/master-data/items/work-in-process-aged-items)

## Setting up Varietals

### Navigate to the Varietals page

1. Go to the navigation sidebar.
2. Click on "Settings" menu item.
3. Click on "Master Data" menu item.
4. Click on "Varietals".

<figure><img src="/files/MOJH6rxWz3FkD9H3bF0R" alt=""><figcaption></figcaption></figure>

### Add a Varietal

1. Go to the options (ellipses) button in the top-right of the page and click on it.
2. Click on "Add Varietal".
3. A tray will slide in from the right. Fill in the following fields:
   * **Name** - The full name of the varietal (e.g., "Pinot Noir")
   * **Code** - A short code identifier (e.g., "PN")
   * **Color** - Select the color classification for this varietal
4. Click on the "Save" button.

{% hint style="info" %}
Varietal names must be at least 3 characters long. The code field is useful for quick identification and data imports.
{% endhint %}

<figure><img src="/files/VZDRukBmWqXV0w3EWBXk" alt=""><figcaption></figcaption></figure>

### Edit a Varietal

1. Click on the Edit icon beside the varietal you wish to edit.
2. A tray will slide in from the right.
3. Modify the name, code, or color as needed.
4. Click on the "Save" button.

### Delete a Varietal

{% hint style="warning" %}
Deleting a varietal may affect items that reference it. Review your item data before deleting a varietal.
{% endhint %}

1. Click on the Edit icon beside the varietal you wish to delete.
2. A tray will slide in from the right.
3. Click on the "Delete Varietal" button.

<figure><img src="/files/tLPCHL4ujPM1Z1aZVJp3" alt=""><figcaption></figcaption></figure>

4. You will be prompted to confirm the deletion.
5. To remove the Varietal, type the word "DELETE" into the input box and click the "Delete" button.

## Varietal Fields

| Field | Description                                 | Required |
| ----- | ------------------------------------------- | -------- |
| Name  | The full name of the varietal               | Yes      |
| Code  | A short identifier code                     | Yes      |
| Color | The color classification (red, white, etc.) | Yes      |


# Vintages

Manage Vintages in Claret to track production years and associate items with specific vintage periods.

Vintages represent specific production years in Claret. They are primarily used in wine and agricultural operations to track when products were produced, enabling vintage-specific planning and inventory management.

{% hint style="info" %}
When a new tenant is created in Claret, a set of default vintages is automatically set up. These include the current year plus five years before and after (11 vintages total). For example, if your tenant was created in 2024, vintages from 2019 to 2029 would be pre-configured.
{% endhint %}

## Managing Vintages

### Navigate to the Vintages page

1. Go to the navigation sidebar.
2. Click on "Settings" menu item.
3. Click on "Master Data" menu item.
4. Click on "Vintages".

### Add a Vintage

If you need to add vintages beyond those pre-configured:

1. Go to the options (ellipses) button in the top-right of the page and click on it.
2. Click on "Add".
3. A tray will slide in from the right. Fill in the following fields:
   * **Name** - The vintage year (e.g., "2030")
   * **Description** - An optional description for this vintage
4. Click on the "Save" button.

{% hint style="info" %}
Vintage names must be unique. Typically, the name is simply the year (e.g., "2024").
{% endhint %}

<figure><img src="/files/NSjIHCrwpxvZ9nEqSxaV" alt=""><figcaption></figcaption></figure>

### Edit a Vintage

1. Click on the Edit icon beside the vintage you wish to edit.
2. A tray will slide in from the right.
3. Modify the name or description as needed.
4. Click on the "Save" button.

### Delete a Vintage

{% hint style="danger" %}
Deleting a vintage may affect items and other data that reference it. Ensure the vintage is not in use before deleting.
{% endhint %}

1. Click on the Edit icon beside the vintage you wish to delete.
2. A tray will slide in from the right.
3. Click on the "Delete Vintage" button.
4. You will be prompted to confirm the deletion.
5. To remove the Vintage, type the word "DELETE" into the input box and click the "Delete" button.

<figure><img src="/files/OTF88sLtt6AWmxSZv9H3" alt=""><figcaption></figcaption></figure>


# Application Settings

Claret App offers extensive application settings to make your business run as efficiently as possible. Discover how to configure the 'Current Fiscal Year', 'Sale Type' and other settings.

There are a number of settings that are required to be set in order for Claret modules to function.

To access the Application Settings, select Application Maintenance and then Application Settings from the main menu.

![](/files/gYNs9OZfBPeNgkw8wJaS)

### General

To enable all modules to function, set the 'Current Fiscal Year'.

![](/files/i0J4nHPUeSvZHAIaWBUU)

### Forecast Workbench

The Forecast Workbench needs the following settings to be configured in order to properly forecast sales.

![](/files/9aRXiW7DBqDKE8N4QP1o)

**Forecast Workbench History Sale Type**

This setting indicates the [sale type](/master-data/sale-types) that Forecast Workbench uses as history data to then project the forecast.

**Forecast Workbench Forecast Sale Type**

This setting indicates the [sale type](/master-data/sale-types) that Forecast Workbench uses to store the forecast it creates.

{% hint style="info" %}
You may wish to [set up a Sale Type](/master-data/calendars) specifically for the forecasts generated by Forecast Workbench so as to not complicated any other forecasts you are working with.
{% endhint %}


# Job Management

Monitor and track background jobs, imports, and system operations in Claret using the Job Management page.

The Job Management area of Claret provides visibility into background jobs and batch operations executed within the app. This includes import operations, system tasks, and other asynchronous processes. You can track job status, view execution details, and download any associated files.

## Viewing Jobs

### Navigate to the Job Management page

1. Go to the navigation sidebar.
2. Click on "Settings" menu item.
3. Click on "Application Maintenance" menu item.
4. Click on "Job Management".

<figure><img src="/files/bR0tyzbtza5JkNuk62gg" alt=""><figcaption></figcaption></figure>

### Understanding the Tabs

The Job Management page has two tabs:

| Tab     | Description                                                  |
| ------- | ------------------------------------------------------------ |
| General | Shows system activity logs for various operations            |
| Imports | Shows background job logs specifically for import operations |

### Job List Grid

The main grid, which appears in the same format on both tabs, displays all jobs with the following information:

| Column      | Description                                                                                          |
| ----------- | ---------------------------------------------------------------------------------------------------- |
| Status      | Visual indicator showing job progress (spinner for in-progress, checkmark for success, X for failed) |
| Job ID      | Unique identifier for the job                                                                        |
| Job         | The type of action performed                                                                         |
| Description | Human-readable description of the specific job                                                       |
| Start       | Timestamp when the job started                                                                       |
| End         | Timestamp when the job completed (or "Still in progress")                                            |
| Failed      | If the job failed, timestamp when the failure occurred                                               |
| Run By      | Username of the person who initiated the job                                                         |

<figure><img src="/files/XY7EcsSzT6oMglUOqz9y" alt=""><figcaption></figcaption></figure>

{% hint style="info" %}
Admin users can see all jobs in the system. Non-admin users only see jobs they have initiated.
{% endhint %}

## Viewing Job Details

To view detailed information about a specific job:

1. Click the Info icon (ℹ️) in the Actions column for the job you want to view.
2. A detail view will open showing comprehensive job information.

<figure><img src="/files/zQU4OOYMG0BBDySQiNpT" alt=""><figcaption></figcaption></figure>

### Job Detail Information

The detail view displays:

* **Job ID** - Unique identifier
* **Job** - Type of operation performed
* **Job Description** - What the job does
* **Start** - When the job began
* **End** - When the job completed
* **Status** - Current state (In Progress, Completed, or Failed)
* **Job Run By** - User who initiated the job
* **Job Run At** - Link to the page where the job was executed

### Downloading Job Files

For jobs that involve file processing (such as imports), you will see additional fields, where you can download associated files:

* **Input Files** - The original files that were uploaded
* **Output Files** - Processed or generated files
* **Error Reports** - For failed imports, CSV files detailing what went wrong

Click the download icon next to each file to save it to your computer.

### Subtask Details

For batch operations, a grid below the job details shows all subtasks that were executed as part of the job. This includes:

* Task name
* Individual task status
* Timestamp
* For failed jobs, this helps identify which specific subtask caused the failure

## Job Statuses

Jobs can have one of three statuses:

| Status      | Description                                       |
| ----------- | ------------------------------------------------- |
| In Progress | The job is currently running                      |
| Completed   | The job finished successfully                     |
| Failed      | The job encountered an error and did not complete |

{% hint style="warning" %}
Failed jobs may have partial results. Check the error reports and subtask details to understand what went wrong.
{% endhint %}


# SAML Manager

Configure SAML 2.0 single sign-on providers to enable secure authentication for your Claret workspace.


# SAML 2.0 with Okta

This guide will step through the requirements for connecting your existing Okta account with SAML 2.0 SSO in Claret.

**Step One:** Within your enterprise/company Okta account, click on "Create App Integration" from the "Applications -> Applications" menu.

<figure><img src="/files/WLK9sKSF5nt5ESpDcwDw" alt=""><figcaption><p>Create App Integration</p></figcaption></figure>

**Step Two:** On the Sign-in method modal, select SAML 2.0

<figure><img src="/files/tqqeE9dPMFeTUCvykCM8" alt=""><figcaption><p>Select SAML 2.0 as the Sign-in method</p></figcaption></figure>

**Step Three:** Name your Claret integration application ("Claret" will work nicely), and feel free to use the logo image below for the logo. This is your own internal application, so whether you use the logo and what you decide to name the application is entirely up to you.

<figure><img src="/files/5uIGaVtRzIS4JaBC4wXj" alt=""><figcaption><p>Name your Integration Application and optionally use our Logo</p></figcaption></figure>

<figure><img src="/files/W1XNNQW0whdiCPHynGF3" alt=""><figcaption><p>Feel free to download this image for use in your Integration Application</p></figcaption></figure>

**Step Four:** Add the following details to the SAML Settings in the "Configure SAML" tab:

{% hint style="info" %}
**NOTE:** All references to `{your_tenant_id}` in the URLs below should be replaced with the tenancy ID (which is a string) for your Claret instance.

For example, our `demo` instance is at `plan.claret.app/demo`. So, `demo` is our tenancy ID there. Our `zymoeno` instance is at `plan.claret.app/zymoeno`. So `zymoeno` is our tenancy ID there.

Therefore, everywhere that `{your_tenant_id}` is referenced below would be replaced with `zymoeno` for our `zymoeno` instance and `demo` for our `demo` instance.
{% endhint %}

#### General Section

1. Single sign-on URL

   This will be <https://plan.claret.app/`{your_tenant_id}`/saml2/callback>

   (e.g. <https://plan.claret.app/`zymoeno`/saml2/callback>)
2. Audience URI (SP Entity ID)

   This will be <https://plan.claret.app/`{your_tenant_id}`/saml2/callback>

   (e.g. <https://plan.claret.app/`zymoeno`/saml2/callback>)
3. Default Relay State

   This will be <https://plan.claret.app/`{your_tenant_id}`/saml2/callback>

   (e.g. <https://plan.claret.app/`zymoeno`/saml2/callback>)
4. Name ID format

   This will be EmailAddress
5. Application username

   This will be Email
6. Update application username on

   This will be Create and update

#### Attribute Statements

* email \[Unspecified] => user.email
* firstName \[Unspeficified] => user.firstName
* lastName \[Unspecified] => user.lastName

<figure><img src="/files/vMdjd18juz3vJbiolFMc" alt=""><figcaption><p>Integration Details - All required - Replace [TENANT ID] with your tenancy name</p></figcaption></figure>

**Step Five:** Feedback Tab

Answer the questions in this tab as follows:

1. Are you a customer or partner?

   Select: "I'm an Okta customer adding an internal app"
2. App type

   Select "This is an internal app that we have created"

<figure><img src="/files/in9QjTtC9pV56szm76yf" alt=""><figcaption><p>Feedback Tab answers</p></figcaption></figure>

<mark style="color:yellow;">**NOTE:**</mark> <mark style="color:yellow;">within your Okta application, you will be able to assign users and groups to the Claret SSO integration application under the "Assignments" tab.</mark>

<figure><img src="/files/G4GOZ513WoEeENCxjEhU" alt=""><figcaption><p>Your company users can be assigned to the SSO integration access in the "Assignments" tab of the Claret Application integration</p></figcaption></figure>

### Connect to Claret

Once the Integration application is set up, you will see some information in the "Sign On" tab. At the bottom of this screen, you will see a button that reads "View SAML setup instructions". Click this button.

<figure><img src="/files/SBQMfKKcQwyzlFwnBvom" alt=""><figcaption><p>Click the "View SAML setup instructions"</p></figcaption></figure>

This will open a separate window which will contain the data you will need to associate your new SSO application with Claret. That window will look like the image below.

<figure><img src="/files/m4MyrUDTmvVBxMUG79be" alt=""><figcaption><p>The information on this screen will be input into Claret</p></figcaption></figure>

An Admin user on the Claret application can now input these details as follows:

1. Visit <https://plan.claret.app/`{your_tenant_id}`/settings/application-maintenance/saml-manager>

<figure><img src="/files/nWMGGrI79s7uxKlOVdhS" alt=""><figcaption><p>SAML Manager page available to admins on Claret</p></figcaption></figure>

2. You can click on Add SAML Provider on the main screen if this is your first SAML connection, or on the "Add SAML Provider" link in the menu in the upper-right-hand corner of the screen.

<figure><img src="/files/qoRgIvlFjB5gZKVoge3a" alt=""><figcaption><p>Click on "Add SAML Provider" via one of the options above</p></figcaption></figure>

3. The form to add the information that you were provided in the "How to Configure SAML 2.0 for \[Claret] Application" window above can now be entered into the Claret SAML form.

<figure><img src="/files/MP13CvMYRnxyjxL7aUS6" alt=""><figcaption><p>Enter the info in the form and click Save</p></figcaption></figure>

Once the information is submitted, you will see a new option on the Claret login form. Anyone in your Okta application that you have granted access to the Claret integration will be able to use this new "Login with Okta" method to sign in to their existing Claret account.

<figure><img src="/files/rsXbaK7jZ9JkUlAVJmaT" alt=""><figcaption><p>Claret users that are listed in your Okta application Assignment list will be able to use this button to log in.</p></figcaption></figure>


# Workspace Settings


# Workspace

Configure your workspace name and view your workspace URL in Claret's Workspace settings.

The Workspace settings page allows you to configure basic workspace identity settings, including your display name and view your workspace's unique URL for accessing Claret. Only Admin users can access and manage workspace settings.

## Configuring Workspace Settings

### Navigate to the Workspace page

1. Go to the navigation sidebar.
2. Click on "Settings" menu item.
3. Click on "Workspace Settings" menu item.
4. Click on "Workspace".

<figure><img src="/files/FDfSNlLrLpO7aCoxbKzb" alt=""><figcaption></figcaption></figure>

## Workspace Settings

### Workspace Name

The workspace name is the display name shown throughout the application for your workspace. To edit this,

1. Enter your desired workspace name in the "Workspace Name" field.
2. Click on the "Save" button.

{% hint style="info" %}
The workspace name can be any alphanumeric text and is used for display purposes throughout Claret.
{% endhint %}

### Workspace Claret URL

The Workspace Claret URL is your unique URL for accessing your Claret workspace. This URL is automatically generated and cannot be changed.

To copy your workspace URL:

1. Click the copy icon next to the URL field.
2. The URL will be copied to your clipboard.

You can share this URL with team members who need to access your workspace.

<figure><img src="/files/XgzzWXgq304Yd04tbe99" alt=""><figcaption></figcaption></figure>

## Workspace Fields

| Field                | Description                          | Editable       |
| -------------------- | ------------------------------------ | -------------- |
| Workspace Name       | The display name for your workspace  | Yes            |
| Workspace Claret URL | Your unique URL for accessing Claret | No (read-only) |

## Saving Changes

When you make changes to the workspace name:

1. The "Save" and "Cancel" buttons will appear.
2. Click "Save" to apply your changes.
3. Click "Cancel" to discard any unsaved changes.

A confirmation message will appear when your changes are saved successfully.


# Team

Maintain your team members in Claret

Only authorized team members can access Claret. In order to get access to the system, you will need to be invited by another team with 'Admin' privileges.

Users in Claret are managed at Settings > Workspace Settings > Team

<figure><img src="/files/IQPK3uqXVNyFHjs2jB0O" alt=""><figcaption></figcaption></figure>

When you enter the Team section, you will see a list of all existing team members, along with details of their access levels.

<figure><img src="/files/PAuCEwgmGLsCZPlKyei6" alt=""><figcaption></figcaption></figure>

### New Team Members

To invite a new team member to Claret, select the 'Invite others' button at the top right of the Team page.

On the modal that appears, you can enter the email address of the team member you wish to add, along with a message that will be sent in the invitation email to the user.

{% hint style="info" %}
After typeing in the email address, hit enter or type a comma. This will wrap the email address in a box. This will indicate that the email is ready to send.
{% endhint %}

Initially, the team member will have 'View Only' access to all modules available to your workspace, however, this can be changed immediately an 'Admin' member after creating the team member if required.

<figure><img src="/files/3zI91nfFdh2YANESx84c" alt=""><figcaption></figcaption></figure>

Once all data has been entered, select to 'Send invite'. The team member will now get an email inviting them to 'Accept Invite'.

![](/files/CLRiPTnpwQDWO3bNkr8O)

When the team member selects 'Accept Invite', they are invited to finish setting up their account by selecting a secure password.

![](/files/pbYtkddJN9TBS6bVELIt)

Once the team member completes this information they will be logged into Claret, with the access levels you assigned during the invitation process.

### Existing Team Members

If you wish to update an existing team member, select the 'edit' pencil icon beside their name.

<figure><img src="/files/pKae5sZSDAk0OJCBw9mZ" alt=""><figcaption></figcaption></figure>

<figure><img src="/files/LUbP48H0PcbMFVBPQXxv" alt=""><figcaption></figcaption></figure>

There are 3 sections you can manage within a team member's profile.

1. **Basic info**

Here you can edit a team member's name and email address.

{% hint style="info" %}
Updating a user's name and email will update any reference to the user within other areas of Claret.
{% endhint %}

<figure><img src="/files/wmL0liWc6x4yuay6ObF3" alt=""><figcaption></figcaption></figure>

2. **Password Reset**

You can also reset a team member's password. (See [Password Reset](/workspace-settings/team/password-reset)).

<figure><img src="/files/m53dN6DJgFxQMbzQ1jJz" alt=""><figcaption></figcaption></figure>

3. **Privileges**

You can manage the access levels for the team member. See [Team Member Privileges](/workspace-settings/team/team-member-privileges)


# Team Member Privileges

Claret allows admins to set and manage team member privileges for custom access levels. The Claret interface makes it easy to create full access or configure specific roles and functions.

Privileges for team members in Claret are managed within a team member's profile. Only 'Admin' team members can alter other team member privileges.

## Licensing and Seat Limits

Each module in Claret has a licensed number of Planner seats. When assigning privileges, you cannot exceed the number of Planner seats available for that module. If you attempt to assign more Planner seats than your subscription allows, the system will display a warning and prevent you from saving.

{% hint style="info" %}
**Stripe-managed subscriptions:** If your workspace subscription is managed through Stripe, you can adjust your Planner seat counts in [Plans and Billing](/workspace-settings/plans-and-billing).

**Custom subscriptions:** If your subscription is managed externally by Claret, contact Claret support to adjust your seat limits.
{% endhint %}

## Privilege Levels

Within each feature, there are three possible privileges:

1. Planner - This gives the team member full access to all functionality, allowing data to be added, edited and deleted.
2. View Only - This allows the team member to read and view data, but no changes are able to be made.
3. No Access - The team member will not even be able to see the feature in the menu.

Go to Settings > Workspace Settings > Team

<figure><img src="/files/LQawqnWeApXauvyU4hqP" alt=""><figcaption></figcaption></figure>

<figure><img src="/files/o5UUxCoYZPCuQaKnkGEp" alt=""><figcaption></figcaption></figure>

You will then be able to edit a team member's access levels against modules and settings. This can be done by clicking the 'chiclet' against the team member's name, in the relevant permission column, and then selecting the option.

{% hint style="info" %}
'Admin' team member permissions cannot be managed at the lower level. If you wish to do this you must first remove the admin privilege.
{% endhint %}

<figure><img src="/files/sS94HUOxtyyB2dMJ6fFP" alt=""><figcaption></figcaption></figure>

## Individual Team Member Settings

To edit an team member's settings, select the 'edit' pencil icon beside the team member who's privileges you wish to manage.

<figure><img src="/files/o5UUxCoYZPCuQaKnkGEp" alt=""><figcaption></figcaption></figure>

This will open the team member's individual settings page.

<figure><img src="/files/NRcnyCaRQgr13kUJ5Ell" alt=""><figcaption></figcaption></figure>

Within this page there are multiple ways to manage permissions.

### General settings

Above the settings table, there are some options to allow updates across multiple modules. There are two features available here.

1. Set a team member as a 'Workspace Admin' team member. When you select this checkbox, the team member will have access to all functions. This will default all privileges to 'Planner', across all modules and settings.

<figure><img src="/files/oLn08TlEOtb8d3q3LTrF" alt=""><figcaption></figcaption></figure>

2\. You can set the currently selected team member's permissions to be the same as another team member's by using the 'Set Permissions Based On' feature. Simply choose the team member who's permissions you wish to copy, and then select 'Copy permissions'. In the below, our currently selected user, Jacinda Smith, would be set to have the same privileges as Enzo Arthur.

<figure><img src="/files/Ilw7pWGRkbeecW31bq6f" alt=""><figcaption></figcaption></figure>

<figure><img src="/files/Xz8g3TRhIeJy9vmm8vkd" alt=""><figcaption></figcaption></figure>

{% hint style="warning" %}
Using this feature will overwrite any privileges that have already been set for this team member.
{% endhint %}

### Granular Permissions

Some modules contain the ability to edit more granular permissions. If this option is available for a team member, you will be able to click the 'Edit' link in the 'Granular Permissions' column.

<figure><img src="/files/vE0SQKicv8pvVhBdZBWt" alt=""><figcaption></figcaption></figure>

For example, within Sales Collaboration, if a team member has been set to 'Planner', there is also the ability to manage the team member's privileges down to the hierarchy level.

By default, team members will have 'Access To All Hierarchies' and hence will be able to enter any data that has been set within Sales Collaboration as 'editable'.

<figure><img src="/files/B8pMDjpcTZoeMhhpDPQn" alt=""><figcaption></figcaption></figure>

When the switch is turned off however, you can manage whether a team member is able to edit data right down to the lowest level item and customer group level.

First, select the Hierarchy Type and then Hierarchy you wish to change a team member's access for. This will show the items/customer groups within that hierarchy. By default, all items/customer groups will be selected. This means the team member can edit any data related to the selected item/customer group.

<figure><img src="/files/TRiyle7EqwWzgFdWR1rV" alt=""><figcaption></figcaption></figure>

If an item is unselected though, this will mean the team member CANNOT edit any data related to that item in Sales Collaboration.

So, if we remove all access to the 'Premium' item group, this means the team member will not be able to edit any data for Item\@CustomerGroups containing that item, even if the data is set to editable.

<figure><img src="/files/oHz9LGR6p8SrFevVRfnk" alt=""><figcaption></figcaption></figure>

#### Example of a Sales Collaboration view's configuration BEFORE the permission change.

<figure><img src="/files/NwUAIqPwEexbQ34w8xJh" alt=""><figcaption></figcaption></figure>

<figure><img src="/files/XvcGbLGwB2LYxQawLYiR" alt=""><figcaption></figcaption></figure>

#### Example of a Sales Collaboration view AFTER the permission change.

<figure><img src="/files/z4HWNB9S7Xd0q5uWHynD" alt=""><figcaption></figcaption></figure>

{% hint style="warning" %}
Removing a team member's ability to edit data at a certain level also means that the team member will also not be able to enter values ABOVE that level, because they cannot then be filtered down. For example above, you will note that the 'All' input boxes are also no longer available after the permission change to the 'Premium' hierarchy level.
{% endhint %}


# Password Reset

At Claret, we provide a couple of ways to reset passwords.

There are two ways to perform a password reset within Claret.

1. From the main login screen.

If you can't remember your password when logging in, you can click the 'Forgot your password' link on the main login page.

<figure><img src="/files/tr3dJHgk1f1lh9VHIyr1" alt=""><figcaption></figcaption></figure>

You will then be invited to enter your email address, after which a password reset email will be sent to you.

This email will send you a new password.

2\. As an administrator

If you are resetting another team member'ss password, you can do this via their profile via the Team page. A ew password will be sent to the team upon selecting 'Send password reset'.

<figure><img src="/files/jU9hVoL4mPPwRSok7KMb" alt=""><figcaption></figcaption></figure>

The team member can then reset the new password within their own account.


# Plans and Billing

Manage your Claret subscription, adjust licensed seats per module, and view billing information.

The Plans and Billing page provides visibility and control over your Claret subscription. You can view your current plan, adjust the number of licensed seats for each module, see pricing, and manage your billing account.

{% hint style="info" %}
Only workspace administrators and billing users can access the Plans and Billing page.
{% endhint %}

## Viewing Your Subscription

### Navigate to the Plans and Billing page

1. Go to the navigation sidebar.
2. Click on "Settings" menu item.
3. Click on "Workspace Settings" menu item.
4. Click on "Plans and Billing".

<figure><img src="/files/mzl8PnmAKnsa7G5JoJZP" alt=""><figcaption></figcaption></figure>

### Subscription Overview

At the top of the page, you'll see your current billing term (e.g., Monthly or Annual).

The main grid displays your subscribed modules with the following information:

| Column               | Description                                     |
| -------------------- | ----------------------------------------------- |
| Group                | The module category (e.g., Inventory, Sales)    |
| Feature              | The module name                                 |
| Planner seats        | The number of licensed planner seats (editable) |
| Cost                 | The calculated cost for this module             |
| Planner seats (Paid) | Shows current usage (e.g., "5 of 10 used")      |
| Viewer seats         | Viewer access count                             |

<figure><img src="/files/wb7o8xbKHloMSKN31dGW" alt=""><figcaption></figcaption></figure>

## Managing Seats

### Adjusting Seat Count

To change the number of licensed seats for a module:

1. Click on the seat count in the "Planner seats" column for the module you want to adjust.
2. Use the increment (+) or decrement (-) buttons, or type a new number.
3. The cost will automatically recalculate.
4. Review your changes in the total section at the bottom.
5. Click "Update my subscription" to apply the changes.

<figure><img src="/files/QqrisOmOy96dMsqtgXkW" alt=""><figcaption></figcaption></figure>

{% hint style="warning" %}
You cannot reduce the seat count below the number of currently active users for a module. If you need to reduce seats, first remove users from the module.
{% endhint %}

### Reviewing Changes

When you make changes to your seat counts:

* The original cost is shown in gray text
* The new cost is shown in a green badge
* A "Discard changes" button appears to revert your modifications
* The "Update my subscription" button becomes active

### Confirming Changes

1. Click "Update my subscription" when you're ready to apply your changes.
2. A confirmation modal will appear showing a summary of your changes.
3. Review the changes carefully.
4. Click "Confirm" to apply the subscription update.

{% hint style="info" %}
Subscription changes are processed through Stripe. Your billing will be adjusted on your next billing cycle or prorated immediately, depending on your plan terms.
{% endhint %}

## Managing Your Account

### Stripe Customer Portal

To manage your payment methods, view billing history, or make other account changes:

1. Click the "Manage account" button.
2. You'll be redirected to the Stripe customer portal.
3. From here you can:
   * Update payment methods
   * View billing history and invoices
   * Update billing information

<figure><img src="/files/Vl7J4qvFkSferGl6Onam" alt=""><figcaption></figcaption></figure>

<figure><img src="/files/lRBE8CdMVhUpErFvW5EX" alt=""><figcaption></figcaption></figure>

## Adding New Modules

If you need to add modules that aren't currently in your subscription, contact Claret support.

## Troubleshooting

### Error Loading Subscription

If you see an error message when loading subscription information:

1. Click the "Retry" button to attempt to reload.
2. If the problem persists, check your internet connection.
3. Contact support if the issue continues.

### Cannot Reduce Seats

If you receive an error when trying to reduce seats, it means you have more active users assigned to that module than the new seat count would allow. You'll need to:

1. Go to the Team settings page.
2. Remove users from the module or adjust their permissions.
3. Return to Plans and Billing to reduce the seat count.


# Overview

Automate the maintenance of your master and transactional data with Claret's powerful data integrations.

Claret requires a set of master data and transactional data to be maintained. This can be done via the user interface or through data integrations. This section of the documentation will cover the different data elements that are required from a data integration standpoint.


# Data Interface Requirements

Below are some of the core data interfaces that are needed to drive Claret

## Master Data

### Finished Good Items

<table><thead><tr><th>Field</th><th>Data Type</th><th>Description</th><th>Example</th><th data-type="checkbox">Required?</th></tr></thead><tbody><tr><td>Parent Item Name</td><td>String (255 character max)</td><td>Unique identifier for parent item (if this item is not in the top level of the hierarchy)</td><td>123A</td><td>false</td></tr><tr><td>Name</td><td>String (255 character max)</td><td>Unique identifier for the item</td><td>123ABC</td><td>true</td></tr><tr><td>Description</td><td>String (255 character max)</td><td>Text to further explain the item. This is not unique.</td><td>ZAM Apps NV CS</td><td>true</td></tr></tbody></table>

### Work in Process (WIP) Items

<table><thead><tr><th>Field</th><th>Data Type</th><th>Description</th><th>Example</th><th data-type="checkbox">Required?</th></tr></thead><tbody><tr><td>Parent Item Name</td><td>String (255 character max)</td><td>Unique identifier for parent item (if this item is not in the top level of the hierarchy)</td><td>123A</td><td>true</td></tr><tr><td>Parent Item Current Vintage</td><td>String (255 character max)</td><td>Year of the current vintage for the bulk item</td><td>2021</td><td>true</td></tr><tr><td>Name</td><td>String (255 character max)</td><td>Unique identifier for the item</td><td>123ABC</td><td>true</td></tr><tr><td>Description</td><td>String (255 character max)</td><td>Text to further explain the item. This is not unique.</td><td>ZAM Apps NV CS</td><td>true</td></tr><tr><td>Routings.Name</td><td>String (255 character max)</td><td>Name of routing if the routing interface (below) is being used. One of this 'Routing' column and 'Age on Release' column is required</td><td>Cabernet Sauvignon Standard Routing</td><td>false</td></tr><tr><td>Age on Release</td><td>Integer</td><td>Duration, in months, of the aging profile for the bulk wine</td><td>12</td><td>false</td></tr><tr><td>Age Start Date</td><td>Date</td><td>The start date for aging</td><td>2024-03-01</td><td>true</td></tr></tbody></table>

### Crop Items

<table><thead><tr><th>Field</th><th>Data Type</th><th>Description</th><th>Example</th><th data-type="checkbox">Required?</th></tr></thead><tbody><tr><td>Parent Item Name</td><td>String (255 character max)</td><td>Unique identifier for parent item (if this item is not in the top level of the hierarchy)</td><td>CAB</td><td>false</td></tr><tr><td>Name</td><td>String (255 character max)</td><td>Unique identifier for the item</td><td>CAB-A</td><td>true</td></tr><tr><td>Description</td><td>String (255 character max)</td><td>Text to further explain the item. This is not unique.</td><td>A Grade Cabernet Sauvignon</td><td>true</td></tr></tbody></table>

### Customer Groups

<table><thead><tr><th>Field</th><th>Data type</th><th>Description</th><th>Example</th><th data-type="checkbox">Required</th></tr></thead><tbody><tr><td>Parent Customer Group Name</td><td>String (255 character max)</td><td>Unique identifier for parent customer group (if this item is not in the top level of the customer group hierarchy)</td><td>789X</td><td>false</td></tr><tr><td>Name</td><td>String (255 character max)</td><td>Unique identifier for the customer group</td><td>789XYZ</td><td>true</td></tr><tr><td>Description</td><td>String (255 character max)</td><td>Text to further explain the customer group. This is not unique.</td><td>Jane’s Liquor</td><td>true</td></tr></tbody></table>

### Locations

<table><thead><tr><th>Field</th><th>Data type</th><th>Description</th><th>Example</th><th data-type="checkbox">Required</th></tr></thead><tbody><tr><td>Name</td><td>String (255 character max)</td><td>Unique identifier for the location</td><td>456WHS</td><td>true</td></tr><tr><td>Description</td><td>String (255 character max)</td><td>Text to further explain the location. This is not unique.</td><td>ZAM Warehouse</td><td>true</td></tr></tbody></table>

### Item @ Locations

<table><thead><tr><th>Field</th><th>Data type</th><th>Description</th><th>Example</th><th data-type="checkbox">Required</th></tr></thead><tbody><tr><td>Items.Name</td><td>String (255 character max)</td><td>This is the unique name used in the Items table</td><td>123ABC</td><td>true</td></tr><tr><td>Locations.Name</td><td>String (255 character max)</td><td>This is the unique name used in the Locations table</td><td>456WHS</td><td>true</td></tr></tbody></table>

### Item @ Customer Groups

<table><thead><tr><th>Field</th><th>Data type</th><th>Description</th><th>Example</th><th data-type="checkbox">Required</th></tr></thead><tbody><tr><td>Items.Name</td><td>String (255 character max)</td><td>This is the unique name used in the Items table</td><td>123ABC</td><td>true</td></tr><tr><td>Customer Groups.Name</td><td>String (255 character max)</td><td>This is the unique name used in the Customer Groups table</td><td>789XYZ</td><td>true</td></tr></tbody></table>

### Routings

<table><thead><tr><th width="201.33333333333331">Field</th><th width="201">Data type</th><th width="197">Description</th><th width="157">Example</th><th data-type="checkbox">Required</th></tr></thead><tbody><tr><td>Routing Name</td><td>String (255 character max)</td><td>Unique identifier for the routing</td><td>Cabernet Sauvignon Standard Routing</td><td>true</td></tr><tr><td>Routing Description</td><td>String (255 character max)</td><td>Text to further explain the routing. This is not unique.</td><td>Standard aging profile for Cabernet Sauvignon</td><td>true</td></tr><tr><td>Time in Barrel</td><td>Integer</td><td>Number, in months, of time spent in barrel for this profile</td><td>6</td><td>false</td></tr><tr><td>Time in Tank</td><td>Integer</td><td>Number, in months, of time spent in tank for this profile</td><td></td><td>false</td></tr><tr><td>Time in Bottle</td><td>Integer</td><td>Number, in months, of time spent in bottle for this profile</td><td>6</td><td>false</td></tr></tbody></table>

### Recipes

<table><thead><tr><th width="203">Field</th><th width="200">Data Type</th><th width="200">Description</th><th width="179">Example</th><th data-type="checkbox">Required?</th></tr></thead><tbody><tr><td>Items.Name as Recipe Header</td><td>String (255 character max)</td><td>Unique identifier, from the Items table, that the recipe is for</td><td>123A</td><td>true</td></tr><tr><td>Locations.Name</td><td>String (255 character max)</td><td>This is the unique name used in the Locations table. Only required if recipes are to be location specific (for example with crops)</td><td>456WHS</td><td>false</td></tr><tr><td>Yield Quantity</td><td>Decimal (8,2)</td><td>The yield amount for the recipe</td><td>1.00</td><td>true</td></tr><tr><td>Yield UOM</td><td>String (255 character max)</td><td>Unit of measure that this yield represents. Note: Claret has a list of UOMs to choose from.</td><td>9LE Case</td><td>true</td></tr><tr><td>Items.Name as Ingredient</td><td>String (255 character max)</td><td>Unique identifier, from the Items table, for the ingredient of the recipe. (If there is more than one ingredient another row of data will be required)</td><td>ZAMNVCS21</td><td>true</td></tr><tr><td>Quantity</td><td>Decimal (12,4)</td><td>Quantity of the ingredient in the recipe</td><td>0.2</td><td>true</td></tr><tr><td>UOM</td><td>String (255 character max)</td><td>Unit of measure that this quantity represents. Note: Claret has a list of UOMs to choose from.</td><td>Ton</td><td>true</td></tr><tr><td>Convert to UOM</td><td>String (255 character max)</td><td>Unit of measure that this quantity should be converted to (if required). Note: Claret has a list of UOMs to choose from.</td><td>Gallon</td><td>false</td></tr><tr><td>Conversion Factor</td><td>Decimal (8,2)</td><td>If 'Convert to UOM' is populated, the conversion factor to make this conversion</td><td>3</td><td>false</td></tr><tr><td>Waste Factor</td><td>Decimal (12,4)</td><td>The % of waste lost during conversion</td><td>1.00%</td><td>false</td></tr></tbody></table>

## Transactional Data

### Sales

This contains sales history, sales forecasts and any other sales projection data.

<table><thead><tr><th>Field</th><th>Data type</th><th>Description</th><th>Example</th><th data-type="checkbox">Required</th></tr></thead><tbody><tr><td>Items.Name</td><td>String (255 character max)</td><td>This is the unique name used in the Items table</td><td>123ABC</td><td>true</td></tr><tr><td>Customer Groups.Name</td><td>String (255 character max)</td><td>This is the unique name used in the Customer Groups table</td><td>789XYZ</td><td>true</td></tr><tr><td>Sell Date</td><td>Date</td><td>The date when this sale took place(in the case of historical sales) or when the sale will take place(forecasted sales)</td><td>2023-01-01</td><td>true</td></tr><tr><td>Timing Interval</td><td>String (255 character max)</td><td>Timing interval that the Sell Date represents. Note: Claret has a list of Timing Intervals to choose from.</td><td>month</td><td>true</td></tr><tr><td>Quantity</td><td>Decimal (16,4)</td><td>The sales quantity that this record represents</td><td>100</td><td>true</td></tr><tr><td>UOM</td><td>String (255 character max)</td><td>Unit of measure that this quantity represents. Note: Claret has a list of UOMs to choose from.</td><td>9LE Case</td><td>true</td></tr><tr><td>Sale Type</td><td>String (255 character max)</td><td>Identifies what kind of sales data this row represents (e.g. “Budget”,“History”, etc.). Note: Claret has a list of Sale Types that are user-defined.</td><td>Forecast</td><td>true</td></tr></tbody></table>

### Inventory: Bulk wine

<table><thead><tr><th>Field</th><th>Data type</th><th>Description</th><th>Example</th><th data-type="checkbox">Required</th></tr></thead><tbody><tr><td>Items.Name</td><td>String (255 character max)</td><td>This is the Intended Use or Program of the bulk wine</td><td>ZAMNVCS21</td><td>true</td></tr><tr><td>Locations.Name</td><td>String (255 character max)</td><td>Location where the inventory is located.</td><td>ZAM-WINERY</td><td>true</td></tr><tr><td>Bin</td><td>String (255 character max)</td><td>The identifier for where the bulk wine is located within the location(e.g. Tank 123, Barrel Group ABC, etc.)</td><td>Tank 123</td><td>true</td></tr><tr><td>Location area</td><td>String (255 character max)</td><td>Section of the winery. Usually to help group the bins (tanks). For instance, “Northeast Tank Group”.</td><td>Northeast Tank Group</td><td>true</td></tr><tr><td>Lot</td><td>String (255 character max)</td><td>Unique lot code for the bulk wine</td><td>LOT.123.ABC</td><td>true</td></tr><tr><td>Quantity</td><td>Decimal (16,4)</td><td>The amount of inventory.</td><td>100000</td><td>true</td></tr><tr><td>UOM</td><td>String (255 character max)</td><td>Unit of measure that this quantity represents (e.g. “Gallon”,“Liter”,etc.). Note: Claret has a list of UOMs to choose from.</td><td>Gallon</td><td>true</td></tr><tr><td>Fill Date</td><td>Date</td><td>The date this bin (tank/vessel)was filled with this wine.</td><td>2021-09-15</td><td>true</td></tr></tbody></table>

### Inventory: Finished goods

Note: Same data fields as Bulk Wine inventory

<table data-header-hidden><thead><tr><th>Field</th><th>Data type</th><th>Description</th><th>Example</th><th data-type="checkbox">Required?</th></tr></thead><tbody><tr><td>Items.Name</td><td>String (255character max)</td><td>This is the non-vintage item (e.g.“Bonanza”)</td><td>123ABC</td><td>true</td></tr><tr><td>Locations.Name</td><td>String (255character max)</td><td>Storage location</td><td>456WHS</td><td>true</td></tr><tr><td>Bin</td><td>String (255character max)</td><td>Not necessary</td><td>Generic FG Bin</td><td>false</td></tr><tr><td>Location area</td><td>String (255character max)</td><td>Not necessary</td><td>Generic FG Area</td><td>false</td></tr><tr><td>Lot</td><td>String (255character max)</td><td>Not necessary</td><td>Generic lot</td><td>false</td></tr><tr><td>Quantity</td><td>Decimal (16,4)</td><td>The amount of inventory</td><td>1000</td><td>true</td></tr><tr><td>UOM</td><td>String (255character max)</td><td>Unit of measure that this quantity represents. Note: Claret has a list of UOMs to choose from.</td><td>9LE Case</td><td>true</td></tr><tr><td>Fill Date</td><td>Date</td><td>When was this inventory stored. We can assume this to be the date of when we pulled the inventory.</td><td>2023-01-01</td><td>true</td></tr></tbody></table>

### Supply Plan

<table><thead><tr><th>Field</th><th>Data type</th><th>Description</th><th>Example</th><th data-type="checkbox">Required</th></tr></thead><tbody><tr><td>Items.Name</td><td>String (255 character max)</td><td>This is the unique name used in the Items table</td><td>123ABC</td><td>true</td></tr><tr><td>Locations.Name</td><td>String (255 character max)</td><td>This is the unique name used in the Locations table (only required if the Supply Type has a category of 'items-locations' within Claret</td><td>ZAM-WINERY</td><td>false</td></tr><tr><td>Date</td><td>Date</td><td>The date when this supply is planned for<br>(or, historically, when the supply occurred)</td><td>2023-01-01</td><td>true</td></tr><tr><td>Timing Interval</td><td>String (255 character max)</td><td>Timing interval that the Date represents. Note: Claret has a list of Timing Intervals to choose from.</td><td>month</td><td>true</td></tr><tr><td>Quantity</td><td>Decimal (16,4)</td><td>The quantity that this supply plan record represents</td><td>100</td><td>true</td></tr><tr><td>UOM</td><td>String (255 character max)</td><td>Unit of measure that this quantity represents. Note: Claret has a list of UOMs to choose from.</td><td>Gallons</td><td>true</td></tr><tr><td>Supply Type</td><td>String (255 character max)</td><td>Identifies what kind of supply data this row represents (e.g. Make Plan, Crop Supply Plan, etc.). Note: Claret has a list of Supply Types that are user-defined.</td><td>Make Plan</td><td>true</td></tr></tbody></table>


# Inbound File Feed

The ERP-to-Claret file feed: a set of CSV files delivered on a regular cadence to keep Claret's master and transactional data in sync with your source systems.

The Inbound File Feed is Claret's standard integration pattern for clients whose ERP system can produce scheduled CSV exports. On an agreed cadence (typically daily, but weekly or otherwise is fine), the ERP drops a set of CSV files into a secure location; Claret picks them up and loads them.

This section contains the complete file specifications. Each spec is self-contained, covering schema, sample data, and snapshot semantics, and can be shared independently with the team building the export on the ERP side.

## File list

Master data must arrive before any transactional data that references it. Within each category, order doesn't matter.

### Master data

| File                                                                       | What it contains                                                       |
| -------------------------------------------------------------------------- | ---------------------------------------------------------------------- |
| [Locations](/integrations/inbound-file-feed/locations)                     | Locations, location areas, and bins/vessels in one file                |
| [Finished Good Items](/integrations/inbound-file-feed/finished-good-items) | FG items with the full hierarchy flattened across columns              |
| [Bulk Wine Items](/integrations/inbound-file-feed/bulk-wine-items)         | Bulk WIP items with the full hierarchy flattened across columns        |
| [Crops](/integrations/inbound-file-feed/crops)                             | Crop master (varietal groups + crop grades) used as recipe ingredients |
| [Recipes](/integrations/inbound-file-feed/recipes)                         | FG / bulk-wine ↔ ingredient mapping (bulk wines and/or crops)          |

### Transactional data

| File                                                                   | What it contains                         |
| ---------------------------------------------------------------------- | ---------------------------------------- |
| [Inventory](/integrations/inbound-file-feed/inventory)                 | Bulk and finished-goods on-hand snapshot |
| [Bottling Schedule](/integrations/inbound-file-feed/bottling-schedule) | Planned bottling runs                    |
| [Work Plans](/integrations/inbound-file-feed/work-plans)               | Work orders / cellar tasks               |

## Common file format

All files in the feed follow the same conventions:

* CSV, UTF-8 encoded
* Comma-delimited
* Header row required (first line, exact column names per each spec)
* Double-quote any field containing whitespace, a comma, a newline, or a double-quote; escape embedded double-quotes as `""`. Quoting whitespace-only fields is technically optional per RFC 4180, but some CSV parsers silently trim leading whitespace after a delimiter; quoting eliminates that ambiguity.

{% hint style="info" %}
Each spec gives the exact header row to use. The order of columns in the header is the order Claret expects in the data rows.
{% endhint %}

## A note on "planning" vs. "transactional" item levels

Several of the files reference items at different levels of the item hierarchy. This is a deliberate split:

* **Planning level** (e.g., the `item_name` of an FG). Used by forward-looking files like the Bottling Schedule. Plans are made at the SKU-family grain.
* **Transactional level** (e.g., the `vintage_name` of an FG, or `child_wip_name` of a bulk wine). Used by Inventory, Recipes, and Work Plans. Actuals always operate on a specific vintage.

The Finished Good Items and Bulk Wine Items specs explain the distinction in detail. If your hierarchy doesn't have a vintage level for some items, that's fine; those items reference the planning level for both purposes.

## Snapshot semantics, in brief

Each spec calls out its own semantics, but the general rules are:

* **Master data files** are full snapshots: omitting a row marks the entity retired.
* **Inventory** is a full snapshot: omitting an emptied bin is fine, but to clear a position, send `quantity=0`.
* **Bottling Schedule** is a full forward-looking snapshot: a plan absent from a new snapshot is cancelled.
* **Work Plans** is the exception: re-deliveries update by `external_system_id`, but a plan absent from today's file is **not** auto-cancelled. To cancel, send the row with `status=Cancelled`.


# Locations

Master data file describing the location hierarchy: Locations → Location Areas → Bins (vessels and tanks). One row per entity, with the hierarchy expressed via a parent\_name reference.

A single combined file describing the location hierarchy: **Locations → Location Areas → Bins (vessels/tanks)**. One row per entity. The hierarchy is expressed via a `parent_name` reference.

## Schema

<table><thead><tr><th>#</th><th>Column</th><th data-type="checkbox">Required?</th><th>Description</th><th>Example</th></tr></thead><tbody><tr><td>1</td><td><code>entity_type</code></td><td>true</td><td>One of: <code>location</code>, <code>location_area</code>, <code>bin</code>. Identifies which level of the hierarchy this row represents.</td><td><code>bin</code></td></tr><tr><td>2</td><td><code>name</code></td><td>true</td><td>Identifier. Must be unique within its <code>entity_type</code>.</td><td><code>SS-01</code></td></tr><tr><td>3</td><td><code>parent_name</code></td><td>true</td><td>Required for <code>location_area</code> and <code>bin</code>. The parent's <code>name</code>. For <code>location_area</code>, the parent is a <code>location</code>. For <code>bin</code>, the parent is a <code>location_area</code>. Empty for <code>location</code> rows.</td><td><code>North</code></td></tr><tr><td>4</td><td><code>description</code></td><td>false</td><td>Human-readable description.</td><td><code>Stainless Steel Tank 01</code></td></tr><tr><td>5</td><td><code>bin_type</code></td><td>false</td><td>Only used when <code>entity_type=bin</code>. One of: <code>FG-BIN</code>, <code>Vessel-Stainless</code>, <code>Vessel-Barrel</code>.</td><td><code>Vessel-Stainless</code></td></tr><tr><td>6</td><td><code>external_system_id</code></td><td>false</td><td>Only used when <code>entity_type=bin</code>. The client's internal identifier for the bin.</td><td><code>BIN-1001</code></td></tr></tbody></table>

## Header row

```
entity_type,name,parent_name,description,bin_type,external_system_id
```

## Sample data

```csv
entity_type,name,parent_name,description,bin_type,external_system_id
location,ZAM-WINERY,,"ZAM Apps Winery",,
location,ZAM-WHS,,"ZAM Apps Warehouse",,
location,ZAM-PARTNER,,"ZAM Partner Warehouse",,
location_area,North,ZAM-WINERY,"North Tank Farm",,
location_area,South,ZAM-WINERY,"South Tank Farm",,
location_area,Storage,ZAM-WHS,Storage,,
location_area,"South Storage Building",ZAM-PARTNER,"Storage Building in Southern Area",,
bin,SS-01,North,"Stainless Steel Tank 01",Vessel-Stainless,BIN-1001
bin,SS-02,North,"Stainless Steel Tank 02",Vessel-Stainless,BIN-1002
bin,SS-03,North,"Stainless Steel Tank 03",Vessel-Stainless,BIN-1003
bin,FG-GEN-BIN,Storage,"Finished Good Generic Holding Bin",FG-BIN,BIN-2001
bin,Refrigerator,"South Storage Building","Large Refrigerator",FG-BIN,BIN-3001
```

## Snapshot semantics

* Full snapshot every delivery. Include every active location, area, and bin.
* A `location` row must appear before any `location_area` that references it; a `location_area` row must appear before any `bin` that references it. Order rows accordingly so a single forward-pass parser will validate cleanly.
* Names must be unique within their `entity_type`.
* Renames are not supported in-place. To rename, deliver the new name as a new row.


# Finished Good Items

Master data file delivering Claret's finished-goods item hierarchy in a single flat file, with every level flattened across columns on each row.

Finished-goods item master. Delivers Claret's full item hierarchy in a single file, with every level flattened across columns on each row.

## About the hierarchy

By default, Claret expects a four-level hierarchy: **Brand Group → Brand → Item → Vintage**. For example:

* **Brand Group:** `Premium`
* **Brand:** `ZAM`
* **Item:** `122` (ZAM Napa Valley Cabernet Sauvignon 12 x 750ml)
* **Vintage:** `122-16`, `122-17`, ... `122-24` (one per vintage year)

**If your item hierarchy differs in either depth or naming, that is fine.** Provide your own level names as column pairs in your hierarchy's order, from highest (most general) to lowest (most granular), using the pattern `{Level} Name, {Level} Description`. Replace `{Level}` with the name of each level you use. Examples:

* Two-level: `Item Name, Item Description, Vintage Name, Vintage Description`
* Three-level: `Brand Name, Brand Description, Item Name, Item Description, Vintage Name, Vintage Description`
* Five-level: `Category Name, Category Description, Brand Group Name, Brand Group Description, Brand Name, Brand Description, Item Name, Item Description, Vintage Name, Vintage Description`

If you adapt the columns to your own hierarchy, email `help@claret.app` describing your levels in order so the labels can be applied in Claret's UI.

## Planning level vs. Transactional level

This is a key concept for the integration. In the default hierarchy, **two of the four levels are referenced by other files**, and they serve different purposes:

| Level                        | Example  | Used as the reference in                                                                                                                                             | Purpose                                                                             |
| ---------------------------- | -------- | -------------------------------------------------------------------------------------------------------------------------------------------------------------------- | ----------------------------------------------------------------------------------- |
| **Item** (`item_name`)       | `122`    | [Bottling Schedule](/integrations/inbound-file-feed/bottling-schedule), supply plans, budgets, forecasts                                                             | Forward-looking **planning**: "we plan to bottle 1,500 cases of 122 in May"         |
| **Vintage** (`vintage_name`) | `122-16` | [Inventory](/integrations/inbound-file-feed/inventory), [Recipes](/integrations/inbound-file-feed/recipes), [Work Plans](/integrations/inbound-file-feed/work-plans) | Actuals / **transactional** data: "we have 879 cases of 122-16 in FG-GEN-BIN today" |

**Why the split:** Plans are made at the SKU-family grain (you commit to bottling a certain volume of `122` per period), but actual production, inventory, and recipes always operate on a specific vintage (`122-16`), because the wine in the bottle is a particular year's wine.

**Special case: items without a Vintage level.** Some items (e.g., `124` "ZAM Lodi Zinfandel 12 x 750ml" below) don't have vintages. For these, the **Item level** serves as both the planning and the transactional reference, and rows in this file will have the Vintage columns blank. Downstream transactional files for these items should reference the `item_name` directly.

## Schema

One row per leaf-level entry. For items with vintages, that's one row per vintage. For items without vintages, that's one row at the item level with the vintage columns blank.

<table><thead><tr><th>#</th><th>Column</th><th data-type="checkbox">Required?</th><th>Description</th><th>Example</th></tr></thead><tbody><tr><td>1</td><td><code>brand_group_name</code></td><td>true</td><td>Top-level grouping. Same value repeats across every row in that brand group.</td><td><code>Premium</code></td></tr><tr><td>2</td><td><code>brand_group_description</code></td><td>false</td><td>Long-form description of the brand group.</td><td><code>Premium group</code></td></tr><tr><td>3</td><td><code>brand_name</code></td><td>true</td><td>Mid-level grouping. Same value repeats across every row in that brand.</td><td><code>ZAM</code></td></tr><tr><td>4</td><td><code>brand_description</code></td><td>false</td><td>Long-form description of the brand.</td><td><code>ZAM brand</code></td></tr><tr><td>5</td><td><code>item_name</code></td><td>true</td><td><strong>The planning level.</strong> Referenced by Bottling Schedule and other planning files.</td><td><code>122</code></td></tr><tr><td>6</td><td><code>item_description</code></td><td>false</td><td>Long-form description of the item.</td><td><code>ZAM Napa Valley Cabernet Sauvignon 12 x 750ml</code></td></tr><tr><td>7</td><td><code>vintage_name</code></td><td>false</td><td><strong>The transactional level.</strong> Referenced by Inventory, Recipes, and Work Plans. Leave blank if this item has no vintages. <strong>Must be unique across all rows in the file when present.</strong></td><td><code>122-16</code></td></tr><tr><td>8</td><td><code>vintage_description</code></td><td>false</td><td>Long-form description of the vintage.</td><td><code>ZAM Napa Valley Cabernet Sauvignon 12 x 750ml 2016</code></td></tr></tbody></table>

## Header row

```
brand_group_name,brand_group_description,brand_name,brand_description,item_name,item_description,vintage_name,vintage_description
```

## Sample data

```csv
brand_group_name,brand_group_description,brand_name,brand_description,item_name,item_description,vintage_name,vintage_description
Premium,"Premium group",ZAM,"ZAM brand",122,"ZAM Napa Valley Cabernet Sauvignon 12 x 750ml",122-16,"ZAM Napa Valley Cabernet Sauvignon 12 x 750ml 2016"
Premium,"Premium group",ZAM,"ZAM brand",122,"ZAM Napa Valley Cabernet Sauvignon 12 x 750ml",122-17,"ZAM Napa Valley Cabernet Sauvignon 12 x 750ml 2017"
Premium,"Premium group",ZAM,"ZAM brand",122,"ZAM Napa Valley Cabernet Sauvignon 12 x 750ml",122-18,"ZAM Napa Valley Cabernet Sauvignon 12 x 750ml 2018"
Premium,"Premium group",ZAM,"ZAM brand",122,"ZAM Napa Valley Cabernet Sauvignon 12 x 750ml",122-19,"ZAM Napa Valley Cabernet Sauvignon 12 x 750ml 2019"
Premium,"Premium group",ZAM,"ZAM brand",122,"ZAM Napa Valley Cabernet Sauvignon 12 x 750ml",122-20,"ZAM Napa Valley Cabernet Sauvignon 12 x 750ml 2020"
Premium,"Premium group",ZAM,"ZAM brand",123,"ZAM Sonoma Coast Chardonnay 12 x 750ml",,
Premium,"Premium group",ZAM,"ZAM brand",124,"ZAM Lodi Zinfandel 12 x 750ml",,
```

{% hint style="info" %}
Rows 1-5: item `122` has multiple vintages, one row per vintage with parent columns repeated. Rows 6-7: items `123` and `124` have no vintages, single row each with vintage columns blank.
{% endhint %}

## Snapshot semantics

* Full snapshot every delivery. Include every currently-active item and vintage.
* An item or vintage omitted from a new snapshot is treated as retired; its history is preserved but no new transactional rows referencing it will be accepted.
* `item_name` must be unique across all rows. `vintage_name`, when present, must also be unique across all rows.
* All `Name` and `Description` columns should be populated where applicable. `Description` values appear in Claret's UI (tooltips, search, exports) and improve usability for the people working in the grids.


# Bulk Wine Items

Master data file delivering bulk wine (WIP) items as Parent WIP / Child WIP pairs, with the hierarchy flattened across columns on each row.

Bulk wine (WIP) item master. Each row is one **child WIP** (the lowest, most granular level: a specific vintage of a bulk wine), with its full parent hierarchy **flattened across columns on the same row**.

## About the hierarchy

By default, Claret expects a two-level hierarchy for bulk wine: **Parent WIP → Child WIP**. For example:

* **Parent WIP:** `ZAMNVCAS` (WIP - ZAM Napa Valley Cabernet Sauvignon)
* **Child WIPs:** `ZAMNVCAS16`, `ZAMNVCAS17`, ... `ZAMNVCAS24` (one per vintage year)

The bulk wine hierarchy is **fixed at two levels**: a parent WIP and its child WIPs. If your naming convention differs from `Parent WIP` / `Child WIP` (e.g., you call them `Wine` and `Vintage`, or `Lot Family` and `Lot`), you can substitute your own labels in the column names, using the pattern `{Level} Name, {Level} Description` for each level. The depth, however, must remain two levels.

If you adapt the labels, email `help@claret.app` describing your level names so the labels can be applied in Claret's UI.

## Schema

<table><thead><tr><th>#</th><th>Column</th><th data-type="checkbox">Required?</th><th>Description</th><th>Example</th></tr></thead><tbody><tr><td>1</td><td><code>parent_wip_name</code></td><td>true</td><td>Top-level grouping. Same value repeats across every child WIP under it.</td><td><code>ZAMNVCAS</code></td></tr><tr><td>2</td><td><code>parent_wip_description</code></td><td>false</td><td>Long-form description of the parent WIP. Shown in tooltips and used in search.</td><td><code>WIP - ZAM Napa Valley Cabernet Sauvignon</code></td></tr><tr><td>3</td><td><code>child_wip_name</code></td><td>true</td><td>The vintage-specific WIP. <strong>Must be unique across all rows in the file and across the Finished Good Items file.</strong> Referenced by Inventory, Recipes, and Work Plans.</td><td><code>ZAMNVCAS19</code></td></tr><tr><td>4</td><td><code>child_wip_description</code></td><td>false</td><td>Long-form description of the child WIP. Shown in tooltips and used in search.</td><td><code>WIP - ZAM Napa Valley Cabernet Sauvignon 2019</code></td></tr></tbody></table>

{% hint style="info" %}
**Which level do other files reference?**

* **Inventory** always uses `child_wip_name`.
* **Recipes** may reference either `parent_wip_name` or `child_wip_name`, depending on the level at which the recipe is defined.
* **Work Plans** may reference either `parent_wip_name` or `child_wip_name`, depending on whether the work targets a generic parent wine (e.g., a future blend) or a specific vintage.
  {% endhint %}

## Header row

```
parent_wip_name,parent_wip_description,child_wip_name,child_wip_description
```

## Sample data

```csv
parent_wip_name,parent_wip_description,child_wip_name,child_wip_description
ZAMNVCAS,"WIP - ZAM Napa Valley Cabernet Sauvignon",ZAMNVCAS16,"WIP - ZAM Napa Valley Cabernet Sauvignon 2016"
ZAMNVCAS,"WIP - ZAM Napa Valley Cabernet Sauvignon",ZAMNVCAS17,"WIP - ZAM Napa Valley Cabernet Sauvignon 2017"
ZAMNVCAS,"WIP - ZAM Napa Valley Cabernet Sauvignon",ZAMNVCAS18,"WIP - ZAM Napa Valley Cabernet Sauvignon 2018"
ZAMNVCAS,"WIP - ZAM Napa Valley Cabernet Sauvignon",ZAMNVCAS19,"WIP - ZAM Napa Valley Cabernet Sauvignon 2019"
ZAMNVCAS,"WIP - ZAM Napa Valley Cabernet Sauvignon",ZAMNVCAS20,"WIP - ZAM Napa Valley Cabernet Sauvignon 2020"
CLMCCPIN,"WIP - Clairemont Central Coast Pinot Noir",CLMCCPIN21,"WIP - Clairemont Central Coast Pinot Noir 2021"
FNESLPNO,"WIP - FNE St Lucia Pinot Noir",FNESLPNO26,"WIP - FNE St Lucia Pinot Noir 2026"
```

## Snapshot semantics

* Full snapshot every delivery. Include every currently-active bulk WIP item.
* A WIP omitted from a new snapshot is treated as retired; its history is preserved but no new transactional rows referencing it will be accepted.
* `child_wip_name` must be unique across all rows in the file and across the [Finished Good Items](/integrations/inbound-file-feed/finished-good-items) file.
* All `Name` and `Description` columns should be populated. `Description` values appear in Claret's UI (tooltips, search, exports) and improve usability for the people working in the grids.


# Crops

Master data file delivering crop master records (varietal groups and crops) used as recipe ingredients for bulk wine.

Crops master. Each row is one **Crop** (the lowest, most granular level: typically a varietal × grade or varietal × source classification used in bulk-wine recipes), with its parent **Varietal Group** flattened across columns on the same row.

## About the hierarchy

The crop hierarchy is **fixed at two levels**: a Varietal Group and its Crops. If your naming convention differs from `Varietal Group` / `Crop` (e.g., you call them `Grape` and `Lot Grade`), you can substitute your own labels in the column names, using the pattern `{Level} Name, {Level} Description` for each level. The depth, however, must remain two levels.

By default, Claret expects short codes for the varietal group names with the full varietal name in the description:

* **Varietal Group:** `CAS` (Cabernet Sauvignon), `PIN` (Pinot Noir)
* **Crops:** `CAS-A` (Cabernet Sauvignon - A Grade), `CAS-B`, `CAS-C`, `PIN-A`, ...

If you adapt the labels, email `help@claret.app` describing your level names so the labels can be applied in Claret's UI.

## Schema

<table><thead><tr><th>#</th><th>Column</th><th data-type="checkbox">Required?</th><th>Description</th><th>Example</th></tr></thead><tbody><tr><td>1</td><td><code>varietal_group_name</code></td><td>true</td><td>Top-level grouping. Same value repeats across every crop under it.</td><td><code>CAS</code></td></tr><tr><td>2</td><td><code>varietal_group_description</code></td><td>false</td><td>Long-form description of the varietal group. Shown in tooltips and used in search.</td><td><code>Cabernet Sauvignon</code></td></tr><tr><td>3</td><td><code>crop_name</code></td><td>true</td><td>The specific crop. <strong>Must be unique across all rows in the file and across the Finished Good Items and Bulk Wine Items files.</strong> Referenced by Recipes as an ingredient.</td><td><code>CAS-A</code></td></tr><tr><td>4</td><td><code>crop_description</code></td><td>false</td><td>Long-form description of the crop. Shown in tooltips and used in search.</td><td><code>Cabernet Sauvignon - A Grade</code></td></tr></tbody></table>

## Header row

```
varietal_group_name,varietal_group_description,crop_name,crop_description
```

## Sample data

```csv
varietal_group_name,varietal_group_description,crop_name,crop_description
CAS,"Cabernet Sauvignon",CAS-A,"Cabernet Sauvignon - A Grade"
CAS,"Cabernet Sauvignon",CAS-B,"Cabernet Sauvignon - B Grade"
CAS,"Cabernet Sauvignon",CAS-C,"Cabernet Sauvignon - C Grade"
PIN,"Pinot Noir",PIN-A,"Pinot Noir - A Grade"
```

## Snapshot semantics

* Full snapshot every delivery. Include every currently-active crop.
* A crop omitted from a new snapshot is treated as retired; its history is preserved but no new recipe rows referencing it will be accepted.
* `crop_name` must be unique across all rows in the file and across the [Finished Good Items](/integrations/inbound-file-feed/finished-good-items) and [Bulk Wine Items](/integrations/inbound-file-feed/bulk-wine-items) files.
* All `Name` and `Description` columns should be populated. `Description` values appear in Claret's UI (tooltips, search, exports) and improve usability for the people working in the grids.


# Recipes

Master data file mapping each finished good or bulk wine item to its ingredient components. One row per ingredient; a blend produces multiple rows sharing the same fg\_item\_name.

Maps each **finished-good or bulk-wine item** to the **ingredient item(s)** that go into it. One row per ingredient. A recipe with multiple ingredient components (a blend) is represented as multiple rows sharing the same `fg_item_name` and yield values.

Ingredients can be:

* Another **bulk wine item** (e.g., a bulk wine going into a bottled FG, or one parent WIP rolling up from its vintages)
* A **crop** / raw grape grade (e.g., a parent WIP composed from multiple grape grades sourced from the farm)

## About the item levels referenced

Unlike [Inventory](/integrations/inbound-file-feed/inventory) and [Bottling Schedule](/integrations/inbound-file-feed/bottling-schedule), recipes can be defined at **any item level**; there is no strict planning-vs-transactional split. In practice, you'll see recipes at:

* The **Item level** (e.g., `122`): a generic recipe applied to every vintage of that item
* The **Vintage level** (e.g., `122-16`): a vintage-specific recipe that overrides the item-level one for that year
* The **Parent WIP level** (e.g., `ZAMNVCAS`): a recipe describing how a parent bulk wine is produced (e.g., a blend of crops)
* The **Child WIP level** (e.g., `ZAMNVCAS19`): a vintage-specific bulk wine recipe

Deliver recipes at whatever level your ERP maintains them. Claret will match them to the corresponding items in the Items master files.

## Schema

<table><thead><tr><th>#</th><th>Column</th><th data-type="checkbox">Required?</th><th>Description</th><th>Example</th></tr></thead><tbody><tr><td>1</td><td><code>recipe_type</code></td><td>true</td><td>One of: <code>Strategic, with items only</code>, <code>Operational, with items only</code>, <code>Strategic, with item at locations</code>. Most bottling recipes are <code>Strategic, with items only</code>. See Controlled vocabularies below for definitions.</td><td><code>Strategic, with items only</code></td></tr><tr><td>2</td><td><code>fg_item_name</code></td><td>true</td><td>The finished good produced by this recipe. Must match a name from the Finished Good Items file at any level (<code>item_name</code> or <code>vintage_name</code>) or from the Bulk Wine Items file (<code>parent_wip_name</code> or <code>child_wip_name</code>) if the recipe targets a bulk wine.</td><td><code>122-16</code></td></tr><tr><td>3</td><td><code>yield_quantity</code></td><td>true</td><td>Quantity of finished good produced per recipe execution. Numeric value. Decimals fine, whole numbers fine. No thousands separators.</td><td><code>1</code></td></tr><tr><td>4</td><td><code>yield_uom</code></td><td>true</td><td>Unit of measure for <code>yield_quantity</code>.</td><td><code>9LE Case</code></td></tr><tr><td>5</td><td><code>bulk_item_name</code></td><td>true</td><td>The ingredient item. Must match a <code>parent_wip_name</code> or <code>child_wip_name</code> from the Bulk Wine Items file, or a <code>crop_name</code> from the Crops file.</td><td><code>ZAMNVCAS16</code></td></tr><tr><td>6</td><td><code>bulk_quantity</code></td><td>true</td><td>Quantity of the ingredient consumed per recipe execution. Numeric value. Decimals fine, whole numbers fine. No thousands separators.</td><td><code>2.378</code></td></tr><tr><td>7</td><td><code>bulk_uom</code></td><td>true</td><td>Unit of measure for <code>bulk_quantity</code>. May differ from <code>yield_uom</code> (e.g., crops measured in <code>Ton</code>, wine in <code>Gallon</code>, cases in <code>9LE Case</code>).</td><td><code>Gallon</code></td></tr><tr><td>8</td><td><code>location_name</code></td><td>false</td><td>The location associated with this recipe row. Must match a <code>location</code> from the Locations file. Behavior depends on <code>recipe_type</code>: for <code>Strategic, with items only</code>, leave blank; for <code>Operational, with items only</code>, required and identifies where the recipe is run (all ingredient rows of the same recipe carry the same location); for <code>Strategic, with item at locations</code>, may be populated per ingredient row to identify where each ingredient is sourced (typically a vineyard or other crop location).</td><td><code>ZAM-WINERY</code></td></tr><tr><td>9</td><td><code>waste_factor</code></td><td>false</td><td>Expected waste/loss as a fraction (e.g., <code>0.02</code> = 2%). Numeric value, decimal between 0 and 1. Defaults to <code>0</code> if omitted.</td><td><code>0.02</code></td></tr></tbody></table>

## Header row

```
recipe_type,fg_item_name,yield_quantity,yield_uom,bulk_item_name,bulk_quantity,bulk_uom,location_name,waste_factor
```

## Sample data

```csv
recipe_type,fg_item_name,yield_quantity,yield_uom,bulk_item_name,bulk_quantity,bulk_uom,location_name,waste_factor
"Strategic, with items only",122,1,"9LE Case",ZAMNVCAS,2.3800,Gallon,,0
"Strategic, with items only",122-16,1,"9LE Case",ZAMNVCAS16,2.3776,Gallon,,0
"Strategic, with items only",122-17,1,"9LE Case",ZAMNVCAS17,2.3776,Gallon,,0
"Strategic, with items only",122-18,1,"9LE Case",ZAMNVCAS18,2.3776,Gallon,,0
"Operational, with items only",122-19,1,"9LE Case",ZAMNVCAS19,2.3776,Gallon,ZAM-WINERY,0
"Strategic, with item at locations",ZAMNVCAS,1,Gallon,CAS-A,0.5000,Gallon,,0
"Strategic, with item at locations",ZAMNVCAS,1,Gallon,CAS-B,0.2500,Gallon,,0
"Strategic, with item at locations",ZAMNVCAS,1,Gallon,CAS-C,0.2500,Gallon,,0
"Strategic, with item at locations",CLMCCPIN21,1,Gallon,CAS-A,1.0000,Ton,,0
```

{% hint style="info" %}

* Row 1: an **Item-level** (planning-level) Strategic recipe, a generic recipe for `122` referencing the parent WIP `ZAMNVCAS`.
* Rows 2-4: **Vintage-level** Strategic recipes that override the item-level recipe for the 2016-2018 vintages of `122` (each from its same-year child WIP).
* Row 5: an **Operational** recipe for `122-19` pinned to a specific location (`ZAM-WINERY`). The `location_name` is required on Operational recipe rows; it identifies where the recipe is run.
* Rows 6-8: a **crop-blend recipe** (Strategic, with item at locations). One Gallon of the parent WIP `ZAMNVCAS` is composed from three Cabernet grape grades: `CAS-A` (50%), `CAS-B` (25%), `CAS-C` (25%).
* Row 9: a **child-WIP recipe** sourced from a single crop. One Gallon of `CLMCCPIN21` from 1 Ton of `CAS-A`. Note the unit mix (Ton of crop yielding Gallons of wine).
  {% endhint %}

## Snapshot semantics

* Full snapshot every delivery. Include every active recipe.
* One row per ingredient. A blend with N components produces N rows.
* All rows of the same recipe must share identical values for `recipe_type`, `fg_item_name`, `yield_quantity`, `yield_uom`, and `location_name`.
* A recipe is uniquely identified by (`fg_item_name`, `recipe_type`, `location_name`). Re-delivering the same key with different ingredients replaces the prior recipe atomically.
* A recipe omitted from a new snapshot is treated as retired.

## Controlled vocabularies

### Recipe types

`recipe_type` must be one of:

| Recipe type                         | When to use it                                                                                                                                                                                            |
| ----------------------------------- | --------------------------------------------------------------------------------------------------------------------------------------------------------------------------------------------------------- |
| `Strategic, with items only`        | Default for most bottling recipes. Components are items, and the recipe is not tied to a specific location (the same recipe can be run anywhere).                                                         |
| `Operational, with items only`      | Same component shape, but the recipe **is** tied to a location; the `location_name` column becomes required.                                                                                              |
| `Strategic, with item at locations` | Used when components are tracked at specific source locations (e.g., bulk wine in a particular winery's tank farm). The recipe header does not require a location, but each ingredient row may carry one. |


# Inventory

Transactional file delivering an on-hand inventory snapshot for both bulk wine WIP and finished goods. Both flow through the same file format.

On-hand inventory snapshot for **bulk wine WIP and finished goods**. Both flow through the same file format. The only difference is the underlying master data the rows reference (e.g., `ZAM-WINERY` + tank bins for bulk; `ZAM-WHS` + storage bins for FG).

## Schema

<table><thead><tr><th>#</th><th>Column</th><th data-type="checkbox">Required?</th><th>Description</th><th>Example</th></tr></thead><tbody><tr><td>1</td><td><code>item_name</code></td><td>true</td><td>The item this inventory belongs to, at the <strong>transactional level</strong>. For FG items: this is the <code>vintage_name</code> from the Finished Good Items file when one exists (e.g., <code>122-16</code>), otherwise the <code>item_name</code> (e.g., <code>124</code>). For bulk wine: this is the <code>child_wip_name</code> from the Bulk Wine Items file (e.g., <code>ZAMNVCAS19</code>).</td><td><code>122-16</code></td></tr><tr><td>2</td><td><code>bin_name</code></td><td>true</td><td>Tank or storage location identifier. Must match a <code>bin</code> from the Locations file.</td><td><code>SS-01</code></td></tr><tr><td>3</td><td><code>lot_name</code></td><td>true</td><td>Lot code.</td><td><code>RM19CASRUT.ZAM</code></td></tr><tr><td>4</td><td><code>date_filled</code></td><td>true</td><td>Date the bin was last filled with this lot/item, as <code>YYYY-MM-DD</code>.</td><td><code>2023-08-01</code></td></tr><tr><td>5</td><td><code>quantity</code></td><td>true</td><td>On-hand quantity at snapshot time. Numeric value. Decimals fine, whole numbers fine. No thousands separators.</td><td><code>5000</code></td></tr><tr><td>6</td><td><code>uom</code></td><td>true</td><td>Unit of measure (e.g., <code>Gallon</code>, <code>9LE Case</code>).</td><td><code>Gallon</code></td></tr><tr><td>7</td><td><code>lot_status</code></td><td>false</td><td>Status of the wine in the lot, e.g., <code>RTB</code> (ready to bottle), <code>WIP</code> (work in process), <code>Aging</code>, <code>Blending</code>, <code>Finished</code>. Most relevant for bulk wine rows; typically empty for FG rows. Tracks with the lot, so every row sharing the same <code>lot_name</code> within a file should carry the same <code>lot_status</code>.</td><td><code>RTB</code></td></tr></tbody></table>

## Header row

```
item_name,bin_name,lot_name,date_filled,quantity,uom,lot_status
```

## Sample data

```csv
item_name,bin_name,lot_name,date_filled,quantity,uom,lot_status
ZAMNVCAS19,SS-01,RM19CASRUT.ZAM,2023-08-01,5000,Gallon,RTB
ZAMNVCAS19,SS-02,RM19CASSH.ZAM,2022-07-08,5000,Gallon,Aging
ZAMNVCAS20,SS-03,RM20CASRUT.ZAM,2022-07-08,20000,Gallon,WIP
122-16,FG-GEN-BIN,FG-GEN-LOT,2024-01-01,879,"9LE Case",
124,Refrigerator,FG-GEN-LOT,2024-04-04,2310,"9LE Case",
```

{% hint style="info" %}
Rows 1–3 are bulk wine, referencing child WIPs (`ZAMNVCAS19`, `ZAMNVCAS20`). Row 4 is FG with vintage, and references the vintage level (`122-16`), not the planning level. Row 5 is FG without vintage and references the item level (`124`) directly, because no vintage exists.
{% endhint %}

## Snapshot semantics

* Full snapshot every delivery. Each file is the complete current state, with no partial or delta files.
* One row per **(item, bin, lot, date\_filled)** combination. Multiple lots in the same bin → multiple rows.
* An emptied bin must be reported as a row with `quantity=0` for the most recent (item, lot) it held. This clears the position.
* A bin with no recent activity may be omitted; Claret retains the prior known quantity until the next snapshot.
* `lot_status` should be consistent across all rows that share the same `lot_name` within a single file.


# Bottling Schedule

Transactional file delivering forward-looking planned bottling runs. One row per planned run at the item × location × date × quantity grain.

The planned bottling schedule, a forward-looking production plan. One row per planned bottling run, expressed as a finished-good item × location × date × quantity.

## Schema

<table><thead><tr><th>#</th><th>Column</th><th data-type="checkbox">Required?</th><th>Description</th><th>Example</th></tr></thead><tbody><tr><td>1</td><td><code>item_name</code></td><td>true</td><td>The finished good being bottled, at the <strong>planning level</strong>. Must match an <code>item_name</code> from the Finished Good Items file (not a <code>vintage_name</code>).</td><td><code>122</code></td></tr><tr><td>2</td><td><code>location_name</code></td><td>true</td><td>The site where the bottling run will occur. Must match a <code>location</code> from the Locations file.</td><td><code>ZAM-WINERY</code></td></tr><tr><td>3</td><td><code>date</code></td><td>true</td><td>The planned bottling date (or the period start, depending on <code>timing_interval</code>), as <code>YYYY-MM-DD</code>.</td><td><code>2026-05-12</code></td></tr><tr><td>4</td><td><code>quantity</code></td><td>true</td><td>Planned production quantity. Numeric value. Decimals fine, whole numbers fine. No thousands separators.</td><td><code>1500</code></td></tr><tr><td>5</td><td><code>uom</code></td><td>true</td><td>Unit of measure (e.g., <code>9LE Case</code>).</td><td><code>9LE Case</code></td></tr><tr><td>6</td><td><code>timing_interval</code></td><td>false</td><td>One of: <code>Day</code>, <code>Week</code>, <code>Month</code>. Duration the plan covers. Defaults to <code>Day</code>. Use <code>Week</code> if the schedule is published at week-grain; in that case <code>date</code> should be the Monday of that week.</td><td><code>Day</code></td></tr></tbody></table>

## Header row

```
item_name,location_name,date,quantity,uom,timing_interval
```

## Sample data

```csv
item_name,location_name,date,quantity,uom,timing_interval
122,ZAM-WINERY,2026-05-12,1500,"9LE Case",Day
122,ZAM-WINERY,2026-05-19,2000,"9LE Case",Day
124,ZAM-WINERY,2026-05-13,800,"9LE Case",Day
123,ZAM-WINERY,2026-05-26,1200,"9LE Case",Day
```

{% hint style="info" %}
`item_name` is the planning level (`122`, `124`), not the vintage level (`122-16`). See the [Finished Good Items](/integrations/inbound-file-feed/finished-good-items) spec for the distinction.
{% endhint %}

## Snapshot semantics

* Full forward-looking snapshot every delivery. Every active planned run for any future date should appear in every file.
* Past-dated runs may be omitted once they're realized as actual bottling work plans.
* Plans are matched on the key (`item_name`, `location_name`, `date`); re-delivering the same key overwrites the prior plan.
* A previously-delivered plan absent from a new snapshot will be marked cancelled.


# Work Plans

Transactional file delivering work orders and cellar tasks from the ERP system. Populates Claret's Work Planning module.

Work orders / cellar tasks issued from the ERP system. One row per work plan. In Claret, these populate the **Work Planning** module's board, kanban, and capacity views.

## Schema

<table><thead><tr><th>#</th><th>Column</th><th data-type="checkbox">Required?</th><th>Description</th><th>Example</th></tr></thead><tbody><tr><td>1</td><td><code>external_system_id</code></td><td>true</td><td>The ERP's identifier for this work order. Unique per row. Used as the merge key so re-deliveries update the same work plan in Claret.</td><td><code>WO-2026-0501-001</code></td></tr><tr><td>2</td><td><code>activity_type</code></td><td>true</td><td>The kind of work being done. Must be one of the values in Controlled vocabularies.</td><td><code>Cap Management</code></td></tr><tr><td>3</td><td><code>status</code></td><td>true</td><td>Current state of the work plan. Must be one of the values in Controlled vocabularies.</td><td><code>Scheduled</code></td></tr><tr><td>4</td><td><code>description</code></td><td>true</td><td>Short title.</td><td><code>Punch-downs on Tank 4</code></td></tr><tr><td>5</td><td><code>location_name</code></td><td>true</td><td>The site where the work occurs. Must match a <code>location</code> from the Locations file.</td><td><code>ZAM-WINERY</code></td></tr><tr><td>6</td><td><code>priority</code></td><td>false</td><td>One of: <code>Critical</code>, <code>High</code>, <code>Medium</code>, <code>Low</code>. Defaults to <code>Medium</code>.</td><td><code>High</code></td></tr><tr><td>7</td><td><code>location_area_name</code></td><td>false</td><td>Sub-area within the location. Must match a <code>location_area</code> from the Locations file.</td><td><code>North</code></td></tr><tr><td>8</td><td><code>item_name</code></td><td>false</td><td>The item this work targets, if applicable. Can reference <strong>any</strong> item level: an FG <code>item_name</code> or <code>vintage_name</code> from the Finished Good Items file, or a <code>parent_wip_name</code> or <code>child_wip_name</code> from the Bulk Wine Items file. Use the level that best matches what the work order is actually for. A generic "rack a barrel of Cab" might target the parent WIP <code>ZAMNVCAS</code>; "transfer SS-01 to SS-02" for the 2020 vintage targets <code>ZAMNVCAS20</code>.</td><td><code>ZAMNVCAS20</code></td></tr><tr><td>9</td><td><code>comments</code></td><td>false</td><td>Long-form notes from the ERP.</td><td><code>Twice daily punchdowns until end of fermentation</code></td></tr><tr><td>10</td><td><code>earliest_start_date</code></td><td>false</td><td>The earliest date this work can begin, as <code>YYYY-MM-DD</code>.</td><td><code>2026-05-08</code></td></tr><tr><td>11</td><td><code>due_date</code></td><td>false</td><td>When this work must be completed, as <code>YYYY-MM-DD</code>.</td><td><code>2026-05-12</code></td></tr><tr><td>12</td><td><code>scheduled_start</code></td><td>false</td><td>Planned start, as <code>YYYY-MM-DD HH:MM</code> (24h, client local time).</td><td><code>2026-05-08 07:00</code></td></tr><tr><td>13</td><td><code>scheduled_end</code></td><td>false</td><td>Planned end, as <code>YYYY-MM-DD HH:MM</code>.</td><td><code>2026-05-08 09:00</code></td></tr><tr><td>14</td><td><code>actual_start</code></td><td>false</td><td>Actual start, as <code>YYYY-MM-DD HH:MM</code>. Omit until work begins.</td><td><code>2026-05-08 07:05</code></td></tr><tr><td>15</td><td><code>actual_end</code></td><td>false</td><td>Actual end, as <code>YYYY-MM-DD HH:MM</code>. Omit until work completes.</td><td><code>2026-05-08 08:55</code></td></tr><tr><td>16</td><td><code>quantity</code></td><td>false</td><td>Estimated work quantity (e.g., gallons to move, cases to handle). Numeric value. Decimals fine, whole numbers fine. No thousands separators.</td><td><code>5000</code></td></tr><tr><td>17</td><td><code>uom</code></td><td>false</td><td>Unit of measure for <code>quantity</code>.</td><td><code>Gallon</code></td></tr></tbody></table>

## Header row

```
external_system_id,activity_type,status,description,location_name,priority,location_area_name,item_name,comments,earliest_start_date,due_date,scheduled_start,scheduled_end,actual_start,actual_end,quantity,uom
```

## Sample data

```csv
external_system_id,activity_type,status,description,location_name,priority,location_area_name,item_name,comments,earliest_start_date,due_date,scheduled_start,scheduled_end,actual_start,actual_end,quantity,uom
WO-2026-0501-001,"Cap Management",Scheduled,"Punch-downs on Tank 4",ZAM-WINERY,High,North,ZAMNVCAS20,"Twice daily punchdowns until end of fermentation",2026-05-08,2026-05-12,"2026-05-08 07:00","2026-05-08 09:00",,,3,Hour
WO-2026-0501-002,Filter,"In Progress","Filter Pinot Noir from SS-01 to SS-02",ZAM-WINERY,Medium,North,FNESLPNO26,,2026-05-07,2026-05-09,"2026-05-08 13:00","2026-05-08 17:00","2026-05-08 13:15",,5000,Gallon
WO-2026-0501-003,Bottling,Planned,"Bottling run for 2016 Napa Cab",ZAM-WINERY,High,South,122-16,"Run scheduled per bottling schedule",2026-05-12,2026-05-12,"2026-05-12 06:00","2026-05-12 14:00",,,1500,"9LE Case"
WO-2026-0501-004,Moves,Planned,"Consolidate Cabernet across vintages",ZAM-WINERY,Medium,North,ZAMNVCAS,"Generic move applies to whole Cab parent; target vintage TBD",2026-05-09,2026-05-11,,,,,1500,Gallon
WO-2026-0430-014,Sanitation,Completed,"CIP clean SS-01 post-filtration",ZAM-WINERY,Medium,North,,,2026-04-30,2026-05-01,"2026-04-30 16:00","2026-04-30 18:00","2026-04-30 16:05","2026-04-30 17:50",2,Hour
```

{% hint style="info" %}

* Row 1: bulk wine, **child WIP** target (`ZAMNVCAS20`).
* Row 3: FG bottling, **vintage** target (`122-16`).
* Row 4: bulk wine, **parent WIP** target (`ZAMNVCAS`), used when the work isn't tied to a specific vintage.
* Row 5: no item; work is location-only (sanitation).
  {% endhint %}

## Snapshot semantics

* Full snapshot of all open and recently-closed work plans every delivery. Plans completed or cancelled more than 30 days ago may be omitted.
* `external_system_id` is the merge key; re-delivering the same id updates the existing plan in place.
* A work plan absent from a new file but present in a prior file is **not** treated as cancelled. To cancel, deliver the row with `status=Cancelled`. (This avoids accidental loss when an ERP query temporarily excludes recent records.)
* Activity types, statuses, and priorities must use the controlled vocabularies below. Unknown values will be rejected.

## Controlled vocabularies

### Activity types

`activity_type` must be one of:

`Additions`, `Bottling`, `Cap Management`, `Centrifuge`, `Circulation`, `Cross Flow`, `De-alc`, `De-va`, `Drain/Press`, `Filter`, `Harvest`, `Inventory`, `Measure`, `Moves`, `Oak Additions`, `Pickup Inbound`, `Pickup Outbound`, `Sanitation`, `Site Projects`, `Ullage`

### Statuses

| Status        | Meaning                                                       |
| ------------- | ------------------------------------------------------------- |
| `Planned`     | Work identified but not yet scheduled to a specific date/time |
| `Scheduled`   | Work assigned a specific scheduled start/end                  |
| `In Progress` | Work has started but is not yet complete                      |
| `On Hold`     | Work has been paused; will resume                             |
| `Completed`   | Work is done                                                  |
| `Cancelled`   | Work will not be performed                                    |

### Priorities

`priority` must be one of:

`Critical`, `High`, `Medium`, `Low`


# Quickstart

Create a token and make your first Claret API call in five minutes.

This guide takes you from nothing to a working API call in about five minutes. You will create a token, make your first request, and read the response.

{% hint style="info" %}
Replace `{tenant}` in every URL with your tenant name (for example, `demo`). Replace `{token}` with the token you create in step 1.
{% endhint %}

## 1. Create a token

1. Log into Claret and go to **Settings → Workspace Settings → API Access**.
2. On the **Tokens** tab, click **Create Token**.
3. Name it (for example, `quickstart`) and select the **Read** scope.
4. Click **Create**, then **copy the token now**. It is shown only once.

The token looks like `42|clrt_aBcDeF...`. Keep it somewhere safe.

For more on tokens and scopes, see [Authentication & Tokens](/api-guide/authentication) and the [Scopes Reference](/api-guide/scopes).

## 2. Make your first call

Call a reference endpoint to list units of measure. This is the lightest possible request and confirms everything is wired up:

```bash
curl "https://plan.claret.app/{tenant}/api/v1/uoms" \
  -H "Authorization: Bearer {token}" \
  -H "Accept: application/json"
```

## 3. Read the response

A successful call returns `200` with the standard response envelope:

```json
{
  "message": "Units of measure retrieved.",
  "data": {
    "uoms": [
      { "id": 1, "name": "Liter", "abbr": "L" },
      { "id": 2, "name": "Kilogram", "abbr": "kg" }
    ]
  },
  "meta": {
    "credits": { "cost": 1, "remaining": 9999999 },
    "pagination": { "per_page": 100, "total": 2 }
  },
  "links": {}
}
```

Every response follows this shape:

* `data` holds the result, keyed by the resource name.
* `meta` holds credit usage and pagination details.
* `links` holds navigation links when applicable.

The response headers also report usage: `X-Api-Credits-Remaining` and `X-RateLimit-Remaining`.

## 4. Try a filtered query

Add query parameters to narrow results. This fetches items whose name contains "Chardonnay", sorted by name:

```bash
curl "https://plan.claret.app/{tenant}/api/v1/items?filter[name]=Chardonnay&sort=name&per_page=10" \
  -H "Authorization: Bearer {token}" \
  -H "Accept: application/json"
```

See [Filtering & Sorting](/api-guide/filtering-and-sorting) for the full query syntax and [Pagination](/api-guide/pagination) for paging through large result sets.

## Next steps

| Goal                                        | Guide                                                   |
| ------------------------------------------- | ------------------------------------------------------- |
| Understand tokens and authorization         | [Authentication & Tokens](/api-guide/authentication)    |
| Page through large datasets                 | [Pagination](/api-guide/pagination)                     |
| Filter, sort, and include relationships     | [Filtering & Sorting](/api-guide/filtering-and-sorting) |
| Sync inventory, pull sales, generate a plan | [Common Recipes](/api-guide/recipes)                    |
| Handle errors                               | [Error Reference](/api-guide/errors)                    |
| Browse every endpoint                       | the **API Reference** section                           |


# Authentication & Tokens

How to create and use Claret API tokens, and how access is authorized.

Every Claret API request is authenticated with a **Bearer token**. Tokens are created from the Claret web app under **API Access** and passed in the `Authorization` header of each request.

{% hint style="info" %}
All API documentation uses a `{tenant}` segment in the URL path. Replace it with the name of the tenant making the call (for example, `demo`, `zymoeno`).
{% endhint %}

{% hint style="warning" %}
Looking for the old email-and-password `tokens/create` flow? That endpoint is deprecated. See [Migrating from Legacy Endpoints](/api-guide/migration) for the timeline and a side-by-side comparison.
{% endhint %}

## Creating a token

Tokens are managed in the Claret app under **Settings → Workspace Settings → API Access**, on the **Tokens** tab.

{% hint style="info" %}
The **API Access** page only appears if your workspace has the **Public API** module enabled. If you don't see it in the sidebar, contact a Workspace Admin.
{% endhint %}

![The Tokens tab on the API Access page](/files/x26bby6Z1ScyWbyIU1Tm)

### Step 1 — Open the Create Token modal

Click **Create Token** and fill in the form:

1. **Token Name** — describe what it's for (for example, `Nightly inventory sync`). Required.
2. **Permissions** — select the [scopes](/api-guide/scopes) the token needs. Checking **All Permissions** grants everything and disables the individual options; otherwise pick the specific scopes from the grouped list. At least one is required.
3. **Expiration** — choose **No expiration**, **30 days**, **90 days**, or **365 days**.

The **Create Token** button stays disabled until a name and at least one permission are set.

![The Create API Token modal](/files/MCL8SNkhDeWIpfdrZPrP)

{% hint style="info" %}
A token can never do more than the user who created it. Scopes are the first authorization gate; the creator's UI permissions are the second. See [Two-gate authorization](#two-gate-authorization).
{% endhint %}

### Step 2 — Copy the token

As soon as the token is created, a **Your New API Token** modal appears. This is the **only time** the full token is shown.

1. Click the token box (or the copy icon) to copy it.
2. The modal includes a **Quickstart** section with **cURL / Python / JavaScript** snippets, pre-filled with your tenant URL and token, so you can test it immediately.
3. Tick **I've copied my token** to enable **Done**, then close the modal.

![The token reveal modal with quickstart snippets](/files/GLk4YW5Tk3BbGOTFwUaA)

A token looks like this:

```
42|clrt_aBcDeFgHiJkLmNoPqRsTuVwXyZ0123456789AbCd
```

The portion after the `|` always begins with `clrt_`. Treat the whole string as a secret; anyone holding it can act with the token's scopes and the creator's data access.

{% hint style="danger" %}
Claret stores only a hash of the token, never the plaintext. If you lose it you cannot recover it; revoke it and create a new one. Store tokens in a secret manager or environment variable, never in source control.
{% endhint %}

## Using a token

Pass the token as a Bearer credential on every request:

```bash
curl "https://plan.claret.app/{tenant}/api/v1/items" \
  -H "Authorization: Bearer 42|clrt_aBcDeFgHiJkLmNoPqRsTuVwXyZ0123456789AbCd" \
  -H "Accept: application/json"
```

### Required headers

| Header          | Value              | Notes                                         |
| --------------- | ------------------ | --------------------------------------------- |
| `Authorization` | `Bearer {token}`   | Required on every request.                    |
| `Accept`        | `application/json` | Recommended. Ensures JSON responses.          |
| `Content-Type`  | `application/json` | Required on `POST` requests with a JSON body. |

{% hint style="info" %}
If a request is unauthenticated and the `Accept: application/json` header is missing, the server may return an HTML redirect to the login page instead of a JSON `401`. Always send `Accept: application/json` so authentication failures come back as structured errors.
{% endhint %}

## Two-gate authorization

Access is authorized at **two independent gates** on every request. A request must pass both.

1. **Token scope.** The coarse access category selected when the token was created (Read, Write, Compute, Workflow Sync, Workflow Replace). If the token lacks the scope an endpoint requires, the request returns `403`. See the [Scopes Reference](/api-guide/scopes).
2. **Creator's module permissions.** A token inherits the Claret UI permissions of the user who created it. If that user cannot see a resource in the app, neither can the token, and the request returns `403`.

{% hint style="info" %}
**Rule of thumb:** if the person who created the token can see the data in the Claret UI, the token can read it. If they can't, the token gets a `403`.
{% endhint %}

Because of the second gate, the data a token can reach changes if the creator's permissions change. Provision tokens from a user whose access matches the integration's needs.

## Token lifecycle

| Action             | Where                                              |
| ------------------ | -------------------------------------------------- |
| Create a token     | **API Access → Tokens → Create Token**             |
| List active tokens | **API Access → Tokens**                            |
| Revoke a token     | **API Access → Tokens →** revoke action on the row |

Revoking a token takes effect immediately. Any request made with a revoked token returns `401`.

## Quick connectivity test

Confirm a token works by calling a lightweight reference endpoint:

```bash
curl -s "https://plan.claret.app/{tenant}/api/v1/uoms" \
  -H "Authorization: Bearer {your-token}" \
  -H "Accept: application/json"
```

A `200` with a `data` payload confirms the token is valid and authorized. A `401` means the token is missing, malformed, or revoked; a `403` means it lacks the required scope or module permission.

## Related documentation

* [Quickstart](/api-guide/quickstart) — create a token and make your first call in five minutes.
* [Scopes Reference](/api-guide/scopes) — what each scope grants and which endpoints need it.
* [Error Reference](/api-guide/errors) — full list of status codes and how to resolve them.
* [Migrating from Legacy Endpoints](/api-guide/migration) — moving off the old token flow.


# Scopes Reference

API token scopes, what each one grants, and which endpoints require them.

A token's **scopes** are the first of the [two authorization gates](/api-guide/authentication#two-gate-authorization). Each scope grants a coarse category of access. Select the narrowest set of scopes an integration needs; you can always create a second token for a different job.

## Available scopes

The **API Access** UI presents friendly labels. Each maps to an internal scope string that appears in audit logs and the OpenAPI spec.

| UI label         | Internal scope                | Grants                                                                                 |
| ---------------- | ----------------------------- | -------------------------------------------------------------------------------------- |
| Read             | `public_api.read`             | Read-only access to all `GET` data endpoints (reference and transactional).            |
| Write            | `public_api.write`            | Create and update records on write endpoints.                                          |
| Compute          | `public_api.compute`          | Run compute endpoints (supply plan generation, forecasts).                             |
| Workflow Sync    | `public_api.workflow`         | Trigger workflow sync endpoints (inventory, sales).                                    |
| Workflow Replace | `public_api.workflow.replace` | Required in addition to Workflow Sync to use `replace` mode, which can delete records. |
| All Permissions  | `*`                           | Full access to every endpoint. Use sparingly.                                          |

{% hint style="info" %}
Token, credit, and job-status utility endpoints do not require a data scope. Any valid token can read its own job status.
{% endhint %}

## Scope required per endpoint type

| Endpoint type                | Example                                                        | Required scope                                              |
| ---------------------------- | -------------------------------------------------------------- | ----------------------------------------------------------- |
| Reference data (read)        | `GET /items`, `GET /uoms`, `GET /calendars`                    | `public_api.read`                                           |
| Transactional data (read)    | `GET /sales-data`, `GET /inventory`, `GET /supply-plans`       | `public_api.read`                                           |
| Compute                      | `POST /supply-plans/generate`, `POST /forecasts/generate`      | `public_api.compute`                                        |
| Workflow sync (upsert)       | `POST /workflows/sync-inventory`, `POST /workflows/sync-sales` | `public_api.workflow`                                       |
| Workflow sync (replace mode) | `POST /workflows/sync-inventory` with `"mode": "replace"`      | `public_api.workflow` **and** `public_api.workflow.replace` |

A request that reaches an endpoint without the required scope returns `403`. See the [Error Reference](/api-guide/errors).

## Who can mint which scopes

Creating a token requires a Claret seat with the matching access level:

* **Read** (`public_api.read`) can be created by any user with access to the API Access page.
* **Write**, **Compute**, **Workflow Sync**, **Workflow Replace**, and **All Permissions** require **Planner ("Full Access")** access to the Public API module, or Workspace Admin.

If a user without Planner access tries to create a token carrying a privileged scope, the request is rejected with `403` before the token is minted. The Create Token modal only offers scopes the current user is allowed to mint.

## Related documentation

* [Authentication & Tokens](/api-guide/authentication) — creating and using tokens.
* [API Credits & Usage](/api-guide/credits-and-usage) — how each endpoint type is metered.
* [Error Reference](/api-guide/errors) — resolving `403` scope errors.


# API Credits & Usage

How API requests consume credits, how credits are allocated, and how to monitor your balance.

Claret meters API usage with **credits**. Each request deducts a fixed number of credits based on the kind of work it does. Credits are allocated monthly per tenant.

## Cost categories

Every endpoint belongs to a cost category. The cost is **flat per request**; it does not scale with the number of rows returned or submitted.

| Category           | Credits / request | Endpoints                                                                       |
| ------------------ | ----------------- | ------------------------------------------------------------------------------- |
| Reference data     | 1                 | `GET` on master data (items, uoms, calendars, locations, customer groups, etc.) |
| Transactional data | 5                 | `GET` on sales, inventory, supply plans, financial plans                        |
| Import             | 10                | File-based import endpoints                                                     |
| Compute            | 50                | Supply plan and forecast generation                                             |
| Free               | 0                 | Job status, token management, credit utilities                                  |

{% hint style="info" %}
A few compute and batch endpoints carry an explicit higher cost that reflects the work they trigger: batch supply plan generation is **200**, forecast generation is **100**, and generate-all forecasts is **500**.
{% endhint %}

## Allocation and rollover

* Each tenant receives a **monthly credit allocation** (the default is generous and sized well above expected usage).
* Unused credits **roll over** month to month, up to a cap of **3× the monthly allocation**. Credits above that cap do not accumulate.
* Allocations refresh automatically each month; there is nothing to renew.

{% hint style="info" %}
Credits are allocated monthly. If a tenant consistently approaches its allocation, contact `help@claret.app` to review the allocation.
{% endhint %}

## Monitoring your balance

Every metered response reports credit usage in two places.

**Response headers:**

| Header                    | Meaning                                                  |
| ------------------------- | -------------------------------------------------------- |
| `X-Api-Credits-Used`      | Credits deducted by this request.                        |
| `X-Api-Credits-Remaining` | Credits left in the tenant's balance after this request. |

**Response envelope** (`meta.credits`):

```json
{
  "message": "Items retrieved.",
  "data": { "items": [] },
  "meta": {
    "credits": { "cost": 1, "remaining": 9998999 }
  },
  "links": {}
}
```

### The Usage dashboard

In the Claret app, **Settings → Workspace Settings → API Access → Usage** (Workspace Admins only) gives a fuller picture. Four cards summarize the account:

* **Credit Balance** — credits available right now.
* **Monthly Allocation** — credits granted each month.
* **Rollover Cap** — the ceiling unused credits can accumulate to.
* **Next Allocation** — days until credits refresh.

![The Usage tab with balance cards, chart, and transaction history](/files/KlB9MLuXnVNeWwUEEQ8k)

Below the cards, a chart plots credits used over time (Daily, Weekly, or Monthly), and a **Transaction History** grid lists each allocation and deduction. Rows that bundle a day's activity are clickable, opening a drill-down that itemizes the individual API calls — amount, endpoint, request ID, and time — behind that line.

![Drilling into the API calls behind a day's credit usage](/files/n1ORziYQYOvRX96hiBa0)

For a request-by-request audit trail (timestamp, token, endpoint, method, status, credits, response time), use the **Query Log** tab.

![The Query Log tab listing every API request](/files/GDm9UwaFrZ5SNCUwdKTV)

## Running out of credits

When a tenant's balance cannot cover a request, the request is rejected with `402 Payment Required` and no work is performed. Wait for the monthly refresh, or contact support to review the allocation.

{% hint style="warning" %}
Free-category endpoints (job status, token management) are never blocked by a low balance, so an integration can always check the status of work it already submitted.
{% endhint %}

## Dry runs

Write, compute, and workflow endpoints accept a `dry_run` flag (or the `X-Dry-Run: true` header). A dry-run request validates the payload without performing the work and **does not consume credits**. Use it to check a payload before committing.

## Related documentation

* [Scopes Reference](/api-guide/scopes) — which scope each endpoint type requires.
* [Rate Limiting](/api-guide/rate-limiting) — request-rate limits, separate from credits.
* [Error Reference](/api-guide/errors) — handling `402` and other statuses.


# Rate Limiting

Request-rate limits for the Claret API and how to handle 429 responses.

The Claret API limits how many requests it accepts over time, separately from [credit metering](/api-guide/credits-and-usage). Limits use a **token-bucket** model: each bucket holds a number of request "tokens" up to its capacity, and refills at a steady rate. Each request spends one token; if the bucket is empty, the request is rejected with `429`.

## Limits

Three buckets apply, and a request must satisfy all that are relevant to it.

| Bucket      | Burst capacity | Sustained rate                        | Applies to                                     |
| ----------- | -------------- | ------------------------------------- | ---------------------------------------------- |
| Per token   | 10 requests    | 2 requests / second                   | Every request, scoped to the individual token. |
| Per tenant  | 50 requests    | 17 requests / second                  | All tokens for a tenant combined.              |
| Per compute | 3 requests     | \~1 request / 6 seconds (10 / minute) | Compute and workflow endpoints only.           |

In practice:

* A single token can burst up to **10 requests**, then settles to **2 requests per second**.
* Across all of a tenant's tokens, throughput is capped at roughly **17 requests per second**.
* Expensive **compute and workflow** endpoints (supply plan generation, forecasts, inventory/sales sync) are additionally limited to a burst of **3** and about **10 per minute**, because each one triggers significant downstream work.

## Rate-limit headers

Successful responses include the current state of the per-token bucket:

| Header                  | Meaning                      |
| ----------------------- | ---------------------------- |
| `X-RateLimit-Limit`     | The token bucket's capacity. |
| `X-RateLimit-Remaining` | Tokens left in the bucket.   |

When a request is rejected with `429`, two additional headers tell you when to retry:

| Header              | Meaning                                         |
| ------------------- | ----------------------------------------------- |
| `Retry-After`       | Seconds to wait before retrying.                |
| `X-RateLimit-Reset` | Unix timestamp when capacity becomes available. |

## Handling 429 responses

A throttled request returns `429 Too Many Requests` as an [RFC 9457](/api-guide/errors) problem document:

```json
{
  "type": "https://httpstatuses.com/429",
  "title": "Too Many Requests",
  "status": 429,
  "detail": "Rate limit exceeded. Retry after the period indicated by the Retry-After header.",
  "request_id": "..."
}
```

To handle it gracefully:

1. **Respect `Retry-After`.** Wait the number of seconds it specifies before retrying.
2. **Back off exponentially** if you hit repeated `429`s, rather than retrying in a tight loop.
3. **Spread bulk work out.** For large syncs, prefer fewer large payloads over many small requests. The workflow sync endpoints accept up to 100,000 records per call.

{% hint style="info" %}
Reading `X-RateLimit-Remaining` on normal responses lets a client slow down *before* it gets throttled, which is smoother than reacting to `429`s.
{% endhint %}

## Related documentation

* [API Credits & Usage](/api-guide/credits-and-usage) — credit costs, a separate limit from request rate.
* [Error Reference](/api-guide/errors) — full list of status codes.
* [Common Recipes](/api-guide/recipes) — batching patterns for large syncs.


# Pagination

How the Claret API pages through large result sets — offset and cursor pagination.

All list endpoints paginate their results. The API uses **two pagination styles** depending on the kind of data:

| Style                     | Used by                                                              | Why                                                                             |
| ------------------------- | -------------------------------------------------------------------- | ------------------------------------------------------------------------------- |
| **Offset** (page numbers) | Reference and master data (items, uoms, calendars, locations, etc.)  | These sets are small and benefit from random page access and a total count.     |
| **Cursor**                | Transactional data (sales, inventory, supply plans, financial plans) | These sets are large; cursors page efficiently without an expensive `COUNT(*)`. |

Pagination details appear under `meta.pagination` in every list response.

{% hint style="warning" %}
Looking for the old `current_index` / `next_index` style? That belonged to the legacy endpoints. See [Migrating from Legacy Endpoints](/api-guide/migration).
{% endhint %}

## Offset pagination (reference data)

Control the page with two query parameters:

| Parameter  | Default | Description                                                                                         |
| ---------- | ------- | --------------------------------------------------------------------------------------------------- |
| `page`     | `1`     | The page number to retrieve.                                                                        |
| `per_page` | `25`    | Records per page. Each endpoint has a maximum (commonly 100, up to 1000 for larger reference sets). |

**Request:**

```bash
curl "https://plan.claret.app/{tenant}/api/v1/items?page=2&per_page=50" \
  -H "Authorization: Bearer {token}" \
  -H "Accept: application/json"
```

**Response `meta.pagination`:**

```json
{
  "meta": {
    "pagination": {
      "result_count": 50,
      "current_page": 2,
      "per_page": 50,
      "total": 1234,
      "last_page": 25
    }
  }
}
```

To walk every page, increment `page` until `current_page` equals `last_page`.

## Cursor pagination (transactional data)

Large datasets use an opaque cursor instead of page numbers:

| Parameter  | Default  | Description                                                    |
| ---------- | -------- | -------------------------------------------------------------- |
| `cursor`   | *(none)* | The cursor token for the next page. Omit on the first request. |
| `per_page` | `100`    | Records per page. Maximum `5000`.                              |

**First request** (no cursor):

```bash
curl "https://plan.claret.app/{tenant}/api/v1/inventory?per_page=500" \
  -H "Authorization: Bearer {token}" \
  -H "Accept: application/json"
```

**Response `meta.pagination`:**

```json
{
  "meta": {
    "pagination": {
      "result_count": 500,
      "per_page": 500,
      "has_more": true,
      "next_cursor": "eyJpZCI6MTUwMCwiX3BvaW50c1RvTmV4dEl0ZW1zIjp0cnVlfQ",
      "prev_cursor": null
    }
  }
}
```

**Next request** — pass `next_cursor` back as `cursor`:

```bash
curl "https://plan.claret.app/{tenant}/api/v1/inventory?per_page=500&cursor=eyJpZCI6MTUwMCwiX3BvaW50c1RvTmV4dEl0ZW1zIjp0cnVlfQ" \
  -H "Authorization: Bearer {token}" \
  -H "Accept: application/json"
```

Keep following `next_cursor` until `has_more` is `false`. At that point `next_cursor` is `null` and you have read the entire set.

{% hint style="info" %}
Cursor responses intentionally omit `total` and `last_page`. Counting every matching row on a large transactional table is expensive, so the API reports only whether more pages exist.
{% endhint %}

### Looping in pseudocode

```
cursor = null
repeat:
    response = GET /inventory?per_page=500 (+ &cursor=<cursor> if set)
    process(response.data)
    cursor = response.meta.pagination.next_cursor
until response.meta.pagination.has_more == false
```

## Choosing `per_page`

Larger pages mean fewer requests but heavier responses. Each request also spends [credits](/api-guide/credits-and-usage) and a [rate-limit](/api-guide/rate-limiting) token, so for bulk reads prefer larger pages (up to each endpoint's maximum) over many small ones.

## Related documentation

* [Filtering & Sorting](/api-guide/filtering-and-sorting) — narrow and order results before paging.
* [Rate Limiting](/api-guide/rate-limiting) — why fewer, larger pages are friendlier.
* The **API Reference** — the `per_page` maximum for each endpoint.


# Filtering & Sorting

Query parameter reference for filtering, sorting, and including related data.

Every list endpoint accepts a common set of query parameters to narrow, order, and expand its results. The specific keys each endpoint allows are listed on that endpoint's reference page; this guide covers the shared syntax.

## Filtering

Filters use bracket syntax: `filter[<key>]=<value>`. Combine multiple filters by repeating the parameter; they are applied together (logical **AND**).

```bash
curl "https://plan.claret.app/{tenant}/api/v1/items?filter[name]=Chardonnay&filter[description]=2024" \
  -H "Authorization: Bearer {token}" \
  -H "Accept: application/json"
```

### Filter types

| Type          | Behavior                                                | Example                                                   |
| ------------- | ------------------------------------------------------- | --------------------------------------------------------- |
| Name / text   | Partial, case-insensitive match                         | `filter[name]=Chard`                                      |
| ID            | Exact match                                             | `filter[item_id]=42`                                      |
| Related name  | Partial match on a related record's name                | `filter[customer_group_name]=North`                       |
| Date range    | Paired `_from` / `_to` bounds (inclusive, `YYYY-MM-DD`) | `filter[date_from]=2026-01-01&filter[date_to]=2026-03-31` |
| Numeric range | Paired `_from` / `_to` bounds                           | `filter[quantity_from]=100&filter[quantity_to]=500`       |
| Boolean       | `0` or `1`                                              | `filter[is_crop_location]=1`                              |

{% hint style="info" %}
Date and numeric filters are bounds, not equality. Use `filter[date_from]` and `filter[date_to]` with the same value to match a single day.
{% endhint %}

Filtering on an unsupported key returns `422` with the allowed keys. Each endpoint's reference page lists exactly what it accepts.

## Sorting

Use the `sort` parameter with a field name. Prefix with `-` for descending order. Sort by multiple fields with a comma-separated list (applied left to right).

```bash
# Newest first, then by name ascending
curl "https://plan.claret.app/{tenant}/api/v1/supply-plans?sort=-date,quantity" \
  -H "Authorization: Bearer {token}" \
  -H "Accept: application/json"
```

| Syntax            | Meaning                                                |
| ----------------- | ------------------------------------------------------ |
| `sort=name`       | Ascending by `name`.                                   |
| `sort=-date`      | Descending by `date`.                                  |
| `sort=-date,name` | Descending by `date`, ties broken ascending by `name`. |

Most endpoints allow sorting on `id`, `created_at`, `updated_at`, and a few domain fields (such as `name`, `date`, or `quantity`). Sorting on an unsupported field returns `422`.

## Including related data

Use `include` to embed related records in the response, avoiding extra round-trips. Pass a comma-separated list of relationship names.

```bash
curl "https://plan.claret.app/{tenant}/api/v1/sales-data?include=saleType,itemCustomerGroup,uom" \
  -H "Authorization: Bearer {token}" \
  -H "Accept: application/json"
```

Each included relationship is nested inside its parent record in the `data` payload. The set of allowed includes is endpoint-specific; some includes expand into nested relations (for example, `include=itemCustomerGroup` on sales data returns the item and customer group within it).

{% hint style="info" %}
Including relationships does not change the credit cost of a request. Prefer one request with the includes you need over several requests fetching related records separately.
{% endhint %}

## Putting it together

Filters, sorts, includes, and [pagination](/api-guide/pagination) compose in a single request:

```bash
curl "https://plan.claret.app/{tenant}/api/v1/supply-plans?\
filter[supply_type_name]=Crush&\
filter[date_from]=2026-01-01&\
sort=-date&\
include=supplyType,uom&\
per_page=500" \
  -H "Authorization: Bearer {token}" \
  -H "Accept: application/json"
```

## Related documentation

* [Pagination](/api-guide/pagination) — paging through filtered results.
* The **API Reference** — allowed filters, sorts, and includes per endpoint.
* [Error Reference](/api-guide/errors) — resolving `422` from unsupported parameters.


# Error Reference

Error format and a complete reference of API status codes with resolution steps.

The Claret API reports errors using [RFC 9457](https://www.rfc-editor.org/rfc/rfc9457) "Problem Details for HTTP APIs". Error responses use the `application/problem+json` content type and a consistent body shape.

## Error format

```json
{
  "type": "https://httpstatuses.com/422",
  "title": "Validation Error",
  "status": 422,
  "detail": "The request parameters are invalid.",
  "request_id": "5f8a1c2e-...",
  "errors": {
    "data.0.quantity": ["The quantity field must be a number."]
  }
}
```

| Field        | Always present | Description                                                            |
| ------------ | -------------- | ---------------------------------------------------------------------- |
| `type`       | Yes            | A URI identifying the problem type.                                    |
| `title`      | Yes            | A short, human-readable summary of the problem.                        |
| `status`     | Yes            | The HTTP status code, repeated in the body.                            |
| `detail`     | Yes            | A human-readable explanation specific to this occurrence.              |
| `request_id` | Yes            | Correlates the error with server logs. Include it in support requests. |
| `errors`     | No             | Field-level validation messages, present on `422` responses.           |

{% hint style="info" %}
Every response also carries an `X-Request-ID` header. When reporting a problem to support, include the `request_id` so the exact request can be traced.
{% endhint %}

## Status codes

### Success

| Code           | Meaning                             | Notes                                                       |
| -------------- | ----------------------------------- | ----------------------------------------------------------- |
| `200 OK`       | Request succeeded.                  | Synchronous reads and writes.                               |
| `201 Created`  | Resource created.                   | Token creation.                                             |
| `202 Accepted` | Work accepted for async processing. | Compute and workflow endpoints. Returns a `job_id` to poll. |

### Client errors

| Code  | Title                | What it means                                                                                          | How to resolve                                                                                                                       |
| ----- | -------------------- | ------------------------------------------------------------------------------------------------------ | ------------------------------------------------------------------------------------------------------------------------------------ |
| `400` | Bad Request          | The request was malformed (for example, invalid JSON).                                                 | Check the request body and query string syntax.                                                                                      |
| `401` | Unauthorized         | The token is missing, malformed, or revoked.                                                           | Send a valid `Authorization: Bearer {token}` header. Create a new token if it was revoked. Ensure `Accept: application/json` is set. |
| `402` | Insufficient Credits | The tenant's credit balance cannot cover the request.                                                  | Wait for the monthly credit refresh, or contact support. See [API Credits & Usage](/api-guide/credits-and-usage).                    |
| `403` | Forbidden            | The token lacks the required scope, **or** the token creator lacks module permission for the resource. | Create a token with the [required scope](/api-guide/scopes), or provision it from a user who can see the resource in the Claret UI.  |
| `404` | Not Found            | The resource or route does not exist.                                                                  | Check the URL, the `{tenant}` segment, and the resource ID.                                                                          |
| `409` | Conflict             | A conflicting operation is already in progress, or a duplicate request was detected.                   | For imports, wait for the in-progress job to finish. For retries, reuse the same `Idempotency-Key`.                                  |
| `422` | Validation Error     | The payload failed validation.                                                                         | Read the `errors` object for field-level messages and correct the input.                                                             |
| `429` | Too Many Requests    | A rate-limit bucket is empty.                                                                          | Wait the number of seconds in the `Retry-After` header, then retry with backoff. See [Rate Limiting](/api-guide/rate-limiting).      |

### Server errors

| Code  | Title               | What it means                                                                     | How to resolve                                                                          |
| ----- | ------------------- | --------------------------------------------------------------------------------- | --------------------------------------------------------------------------------------- |
| `500` | Server Error        | An unexpected error occurred.                                                     | Retry after a short delay. If it persists, contact support with the `request_id`.       |
| `503` | Service Unavailable | A dependency (such as the rate-limit or credit store) is temporarily unavailable. | Retry after a short delay. This is rare; the API is configured to fail open by default. |

## Validation errors in detail

`422` responses include an `errors` object keyed by the field path that failed. For array payloads (such as workflow sync), the path includes the row index:

```json
{
  "type": "https://httpstatuses.com/422",
  "title": "Validation Error",
  "status": 422,
  "detail": "The given data was invalid.",
  "request_id": "5f8a1c2e-...",
  "errors": {
    "data.0.item_name": ["The item name field is required."],
    "data.2.uom": ["The selected uom is invalid."]
  }
}
```

Use the index to locate the offending record in your payload.

## Related documentation

* [Authentication & Tokens](/api-guide/authentication) — resolving `401` and `403`.
* [Scopes Reference](/api-guide/scopes) — resolving scope-related `403`.
* [API Credits & Usage](/api-guide/credits-and-usage) — resolving `402`.
* [Rate Limiting](/api-guide/rate-limiting) — resolving `429`.


# Common Recipes

End-to-end examples for the most common API integrations.

Practical, copy-paste walkthroughs for the things integrators do most. Each assumes you have a token; see the [Quickstart](/api-guide/quickstart) if you don't.

{% hint style="info" %}
Replace `{tenant}` and `{token}` throughout. The base URL is `https://plan.claret.app/{tenant}/api/v1`.
{% endhint %}

## Recipe 1 — Sync inventory from an external system

Push current inventory levels into Claret. This is an asynchronous workflow: you submit the data, get a `job_id`, and poll for completion.

**Required scope:** Workflow Sync (`public_api.workflow`). Add Workflow Replace for `replace` mode.

### Step 1 — Submit the inventory

```bash
curl -X POST "https://plan.claret.app/{tenant}/api/v1/workflows/sync-inventory" \
  -H "Authorization: Bearer {token}" \
  -H "Content-Type: application/json" \
  -H "Idempotency-Key: 550e8400-e29b-41d4-a716-446655440000" \
  -d '{
    "mode": "upsert",
    "data": [
      {
        "item_name": "Chardonnay Juice",
        "bin_name": "Tank-01",
        "lot_name": "LOT-2026-001",
        "date_filled": "2026-04-01",
        "quantity": 5000,
        "uom": "Liter"
      }
    ]
  }'
```

* `mode` is `upsert` (default) or `replace`. In `replace` mode you must also send a `scope` (`{"location": "...", "item": "..."}`) identifying what to replace, and the token needs the Workflow Replace scope.
* `data` accepts up to **100,000** rows per request.
* Every row needs `item_name`, `bin_name`, `lot_name`, `date_filled` (`YYYY-MM-DD`), `quantity`, and `uom`.
* The `Idempotency-Key` header (a UUID you generate) makes retries safe — reuse the same value when retrying a request.

The response is `202 Accepted` with a `job_id`.

{% hint style="info" %}
Validate before committing by adding `"dry_run": true`. A dry run checks the payload without writing anything and consumes no credits.
{% endhint %}

### Step 2 — Poll for completion

```bash
curl "https://plan.claret.app/{tenant}/api/v1/jobs/{job_id}" \
  -H "Authorization: Bearer {token}" \
  -H "Accept: application/json"
```

The status moves `pending → in_progress → completed` (or `failed`). Poll every 5 seconds for the first 30 seconds, then every 15 seconds.

{% hint style="info" %}
Prefer file-based ERP exports? Use the CSV variant `POST /workflows/sync-inventory/import` (`multipart/form-data`). See [Sync Inventory](/api-guide/migration/inventory).
{% endhint %}

## Recipe 2 — Pull sales data

Read sales records, filtered by date and type, paging through the full set. Sales use [cursor pagination](/api-guide/pagination#cursor-pagination-transactional-data).

**Required scope:** Read (`public_api.read`).

### Step 1 — First page

```bash
curl "https://plan.claret.app/{tenant}/api/v1/sales-data?\
filter[sale_type_name]=Forecast&\
filter[sell_date_from]=2026-01-01&\
include=saleType,itemCustomerGroup,uom&\
sort=sell_date&\
per_page=1000" \
  -H "Authorization: Bearer {token}" \
  -H "Accept: application/json"
```

### Step 2 — Follow the cursor

Read `meta.pagination.next_cursor` from the response and pass it back as `cursor`:

```bash
curl "https://plan.claret.app/{tenant}/api/v1/sales-data?per_page=1000&cursor={next_cursor}" \
  -H "Authorization: Bearer {token}" \
  -H "Accept: application/json"
```

Repeat until `meta.pagination.has_more` is `false`. The same pattern works for `GET /inventory`, `GET /supply-plans`, and `GET /financial-plans`.

## Recipe 3 — Generate a supply plan

Trigger supply plan computation. There are two modes.

**Required scope:** Compute (`public_api.compute`).

### Option A — Single item-location (synchronous)

Returns the computed plan in the response (up to a 30-second timeout):

```bash
curl -X POST "https://plan.claret.app/{tenant}/api/v1/supply-plans/generate" \
  -H "Authorization: Bearer {token}" \
  -H "Content-Type: application/json" \
  -d '{
    "mode": "internal",
    "item_name": "Chardonnay Juice",
    "location_name": "Napa Winery",
    "view_name": "Default Supply View"
  }'
```

Identify the target by either `item_location_id`, or `item_name` + `location_name`. Identify the view by `view_id` or `view_name`.

### Option B — Whole location (batched, asynchronous)

Queues generation for every item-location at a location and returns a `job_id`:

```bash
curl -X POST "https://plan.claret.app/{tenant}/api/v1/supply-plans/generate-batch" \
  -H "Authorization: Bearer {token}" \
  -H "Content-Type: application/json" \
  -d '{
    "mode": "internal",
    "location_name": "Napa Winery",
    "view_name": "Default Supply View"
  }'
```

Poll `GET /jobs/{job_id}` (Recipe 1, Step 2) until it completes, then read the results with `GET /supply-plans` (Recipe 2's pattern).

{% hint style="warning" %}
Compute and workflow endpoints share a tighter [rate limit](/api-guide/rate-limiting) (a burst of 3, about 10 per minute) and cost more [credits](/api-guide/credits-and-usage). Generate in batches rather than one item at a time where possible.
{% endhint %}

## Related documentation

* [Authentication & Tokens](/api-guide/authentication) and [Scopes Reference](/api-guide/scopes)
* [Pagination](/api-guide/pagination) and [Filtering & Sorting](/api-guide/filtering-and-sorting)
* The **API Reference** — full per-endpoint reference


# AI Agent Integration

Discovery documents and guidance for integrating Claret with AI agents.

The Claret API publishes machine-readable discovery documents so AI agents and tools can learn the API surface automatically. All three are served from the Claret application host.

{% hint style="info" %}
These documents describe the public API generically; they are not tenant-specific. Replace `{tenant}` with a real tenant when an agent actually calls an endpoint.
{% endhint %}

## Discovery documents

| Document           | URL                                                  | Purpose                                                             |
| ------------------ | ---------------------------------------------------- | ------------------------------------------------------------------- |
| OpenAPI spec       | `https://plan.claret.app/api/docs/api.json`          | Full machine-readable API description (paths, parameters, schemas). |
| Interactive docs   | `https://plan.claret.app/api/docs`                   | Human-browsable rendering of the OpenAPI spec.                      |
| `llms.txt`         | `https://plan.claret.app/api/docs/llms.txt`          | Compact, plain-text orientation for LLMs.                           |
| AI plugin manifest | `https://plan.claret.app/.well-known/ai-plugin.json` | Plugin descriptor pointing to the OpenAPI spec and auth method.     |

### OpenAPI specification

The spec is generated directly from the application, so it always reflects the deployed endpoints. Point any OpenAPI-aware tool (code generators, agent frameworks, API explorers) at `https://plan.claret.app/api/docs/api.json`.

### llms.txt

A short plain-text summary an agent can read to orient itself quickly — authentication model, base URL, response envelope, and error format. Fetch it from `https://plan.claret.app/api/docs/llms.txt`.

### AI plugin manifest

The `.well-known/ai-plugin.json` manifest follows the AI plugin convention. It declares Bearer authentication and links to the OpenAPI spec:

```json
{
  "schema_version": "v1",
  "name_for_model": "claret_api",
  "description_for_model": "Claret is a multi-tenant SaaS platform for business planning and operational management. Use this API to query items, sales, inventory, and other business data.",
  "auth": { "type": "service_http", "authorization_type": "bearer" },
  "api": { "type": "openapi", "url": "https://plan.claret.app/api/docs/api.json" },
  "contact_email": "help@claret.app"
}
```

## Provisioning a token for an agent

An agent authenticates exactly like any other client: with a Bearer token (see [Authentication](/api-guide/authentication)). Provision it deliberately:

1. Create a token from **API Access → Tokens** scoped to only what the agent needs — usually **Read** (`public_api.read`) for a data-querying agent.
2. Set a sensible **expiration** so an unattended agent's token doesn't live forever.
3. Supply the token to the agent through a secret, never in a prompt or source file.

{% hint style="info" %}
Because of [two-gate authorization](/api-guide/authentication#two-gate-authorization), an agent's reach is bounded by both its scope and the permissions of the user who created the token. Provisioning from a least-privileged user is a simple way to sandbox an agent.
{% endhint %}

{% hint style="warning" %}
Programmatic, agent-initiated token provisioning (an agent minting its own scoped tokens) is not currently enabled. Provision agent tokens through the **API Access** UI for now.
{% endhint %}

## Designing agent-friendly calls

* **Start at `llms.txt`,** then load the OpenAPI spec for full parameter detail.
* **Read `meta.credits.remaining`** on responses so an agent can stay within budget. See [API Credits & Usage](/api-guide/credits-and-usage).
* **Respect `Retry-After`** on `429` responses rather than retrying immediately. See [Rate Limiting](/api-guide/rate-limiting).
* **Use `dry_run`** on write and compute calls when an agent is uncertain about a payload; it validates without consuming credits or changing data.

## Related documentation

* [Authentication & Tokens](/api-guide/authentication)
* [Scopes Reference](/api-guide/scopes)
* [Error Reference](/api-guide/errors)


# Migrating from Legacy Endpoints

How the legacy Claret API differs from the current REST API, and how to migrate.

Claret's original API is still available, but the current REST API is the recommended way to integrate. This page explains the differences and how to move across.

{% hint style="info" %}
If you are building a new integration, start with the current API and ignore the legacy column below. This page is for existing integrations and for understanding older code.
{% endhint %}

## What changed

| Area           | Legacy API                                                                            | Current API                                                                                                                                                                      |
| -------------- | ------------------------------------------------------------------------------------- | -------------------------------------------------------------------------------------------------------------------------------------------------------------------------------- |
| Authentication | `POST /tokens/create` with email + password, returns a session-style token (`1\|...`) | Tokens created in **API Access** UI with scopes; begin with `clrt_`. See [Authentication](/api-guide/authentication).                                                            |
| Authorization  | Implicit (the user's session)                                                         | [Two gates](/api-guide/authentication#two-gate-authorization): token scope + creator's permissions                                                                               |
| Pagination     | `current_index` / `next_index` index walking                                          | [Offset](/api-guide/pagination#offset-pagination-reference-data) for reference data, [cursor](/api-guide/pagination#cursor-pagination-transactional-data) for transactional data |
| Response shape | Flat JSON with pagination keys mixed in                                               | Envelope: `data`, `meta`, `links`                                                                                                                                                |
| Errors         | Ad-hoc JSON                                                                           | [RFC 9457](/api-guide/errors) `application/problem+json`                                                                                                                         |
| Metering       | None                                                                                  | [Credits](/api-guide/credits-and-usage) and [rate limits](/api-guide/rate-limiting)                                                                                              |

## Endpoint mapping

| Legacy endpoint                          | Current endpoint                                                                         | Notes                                                                                                   |
| ---------------------------------------- | ---------------------------------------------------------------------------------------- | ------------------------------------------------------------------------------------------------------- |
| `POST /tokens/create` (email + password) | Create a token in **API Access → Tokens**                                                | The new flow is UI-driven and scoped. See [Authentication](/api-guide/authentication).                  |
| `GET /sales`                             | `GET /sales-data`                                                                        | Cursor pagination; `filter[...]`, `sort`, `include`. See [Sales Data](/api-guide/migration/sales-data). |
| `GET /supply-plan/get/process`           | `GET /supply-plans`                                                                      | Cursor pagination and structured filters.                                                               |
| `POST /inventory/import/process`         | `POST /workflows/sync-inventory` (JSON) or `POST /workflows/sync-inventory/import` (CSV) | Async with `job_id` polling, `dry_run`, idempotency.                                                    |

## Migrating authentication

The legacy flow exchanged credentials for a token on every run:

```bash
# Legacy — do not use for new integrations
curl -X POST "https://plan.claret.app/{tenant}/api/v1/tokens/create" \
  -d "email=user@example.com&password=secret"
# → { "token": "1|bfDoNPffjU6k541RYSLB68oEfHySweWJ2HSx34sZ" }
```

Replace it with a token created once in the **API Access** UI, stored as a secret, and sent on each request:

```bash
curl "https://plan.claret.app/{tenant}/api/v1/uoms" \
  -H "Authorization: Bearer 42|clrt_..." \
  -H "Accept: application/json"
```

This removes passwords from your integration, scopes access to only what's needed, and lets you revoke a single token without rotating credentials.

{% hint style="warning" %}
The legacy `POST /tokens/create` endpoint is **deprecated and scheduled for removal on 2027-01-01**. Migrate authentication before then. The legacy token-exchange flow will stop working after that date.
{% endhint %}

## Migrating pagination

Legacy endpoints returned an index to carry forward:

```
Legacy:  first call has no current_index → response gives next_index
         pass next_index as &current_index=... until next_index is null
```

The current API replaces this with two clearer models:

* **Reference data** uses page numbers: increment `page` until `current_page == last_page`.
* **Transactional data** uses cursors: follow `meta.pagination.next_cursor` until `has_more` is `false`.

See [Pagination](/api-guide/pagination) for full examples.

## Why the new endpoints use distinct paths

The new REST endpoints were deliberately given distinct paths (for example, `/sales-data` rather than `/sales`) so that existing integrations against the legacy paths keep working unchanged. There is **no forced cut-over date for the data endpoints** — only the legacy authentication endpoint has a dated sunset (above).

If clean paths are reclaimed for the REST API in the future, it will be communicated in advance. Any permanent redirect introduced at that time would use **HTTP 308** (which preserves the request method and body) rather than **301** (which historically allowed clients to downgrade `POST` to `GET`), so automated `POST` clients would continue to work across the redirect.

## Related documentation

* [Authentication & Tokens](/api-guide/authentication)
* [Pagination](/api-guide/pagination)
* The **API Reference**


---

[Next Page](/llms-full.txt/1)